How can you sort and visualize 'cProfile' output to identify performance issues easily?
Sorting and Visualizing 'cProfile' Output for Performance Analysis
Sorting and visualizing the 'cProfile' output can greatly help identify performance issues and bottlenecks in Python code. Analyzing and interpreting 'cProfile' output can be done in various ways, including sorting the results and using visualization tools. Here's how to do it:
Sorting the Profiling Results: By default, 'cProfile' presents the profiling results in the order they were recorded. However, you can sort the results based on different criteria to focus on specific performance metrics. The 'pstats' module, part of Python's standard library, allows you to interactively analyze and sort the profiling data.
Here's how to use 'pstats' to sort profiling results:
Code:
#test.py
#Python Recursion: gcd of two integers
import cProfile
import pstats
def Recurgcd(a, b):
	low = min(a, b)
	high = max(a, b)
	if low == 0:
		return high
	elif low == 1:
		return 1
	else:
		return Recurgcd(low, high%low)
cProfile.run('Recurgcd(12,14)','profile_results')
stats = pstats.Stats('profile_results')
stats.sort_stats('time').print_stats()
Run in Spyder IDE:
Fri Jul 28 20:09:51 2023    profile_results

         12 function calls (10 primitive calls) in 0.000 seconds

   Ordered by: internal time

   ncalls  tottime  percall  cumtime  percall filename:lineno(function)
        1    0.000    0.000    0.000    0.000 {built-in method builtins.exec}
      3/1    0.000    0.000    0.000    0.000 c:\users\me\untitled1.py:6(Recurgcd)
        3    0.000    0.000    0.000    0.000 {built-in method builtins.min}
        1    0.000    0.000    0.000    0.000 <string>:1(<module>)
        3    0.000    0.000    0.000    0.000 {built-in method builtins.max}
        1    0.000    0.000    0.000    0.000 {method 'disable' of '_lsprof.Profiler' objects}
In the above example, we sort the profiling data based on the "time" metric, which shows the cumulative time spent in each function. If you would like to gain a different perspective on the performance of the code, you can also sort by other metrics such as "cumulative time," "number of calls," or "time per call."
Using SnakeViz for Visualization: SnakeViz is a browser based graphical viewer for the output of Python's cProfile module and an alternative to using the standard library pstats module. It was originally inspired by RunSnakeRun. SnakeViz works on Python 3.7+. To use SnakeViz, first install it using the pip:
pip install snakeviz
Then, generate the 'cProfile' data and visualize it with 'SnakeViz':
python -m cProfile -o profile_results my_script.py
snakeviz profile_results
After executing the said two commands SnakeViz will launch a web-based graphical interface showing a visual representation of the profiling data. You can interactively explore the call tree, identify hotspots, and drill down into individual function calls to understand the performance characteristics of your code.
Sample Output:
Icicle:
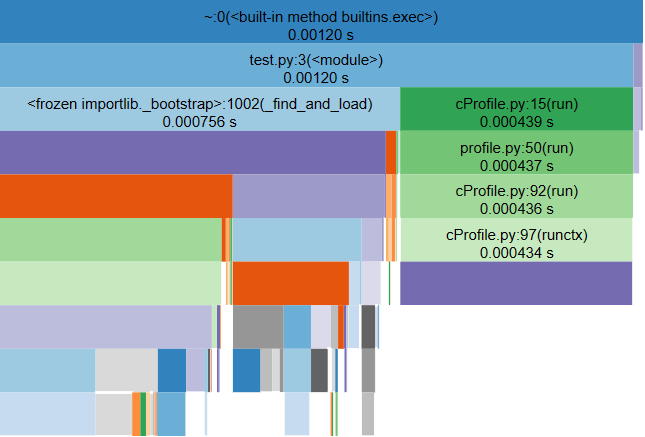
In the icicle visualization style functions are represented by rectangles. A root function is the top-most rectangle, with functions it calls below it, then the functions those call below them, and so on. The amount of time spent inside a function is represented by the width of the rectangle. A rectangle that stretches across most of the visualization represents a function that is taking up most of the time of its calling function, while a skinny rectangle represents a function that is using hardly any time at all.
Sunburst:
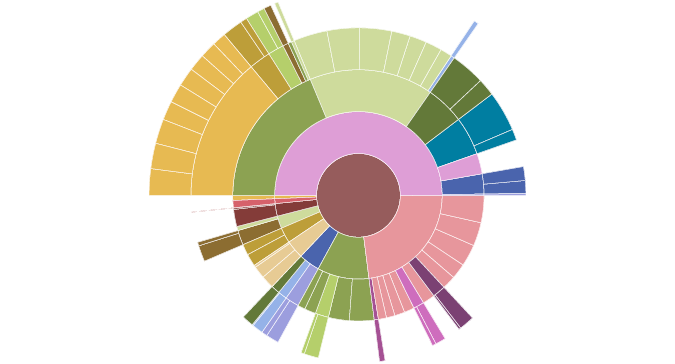
In the sunburst visualization style functions are represented as arcs. A root function is a circle at the middle, with functions it calls around, then the functions those functions call, and so on. The amount of time spent inside a function is represented by the angular extent of the arc (how far around the circle it goes). An arc that wraps most of the way around the circle represents a function that is taking up most of the time of its calling function, while a skinny arc represents a function that is using hardly any time at all.
Function Info:
Placing your cursor over a rectangle or arc will highlight that function and any other visible instances of the same function call. It will also display a list of information to the left of the sunburst.
The displayed information includes:
- Name: function name
- Cumulative Time: total cumulative amount of time spent in the function in seconds and as a percentage of the total program run time.
- File: name of the file in which the function is defined
- Line: line number on which the function is defined
- Directory: directory of the file
Stats Table
Below the visualization is a table of profile data similar to the one you'd see working with Python's built-in cProfile and pstats modules.
| pstats | modules.ncalls | tottime percall | cumtime | percall | filename:lineno(function) |
|---|---|---|---|---|---|
| 1 | 0.0004328 | 0.0004328 | 0.0004328 | 0.0004328 | ~:0(<method 'enable' of '_lsprof.Profiler' objects>) |
| 6 | 0.0002762 | 4.603e-05 | 0.0002762 | 4.603e-05 | ~:0(<built-in method nt.stat>) |
| 20 | 8.74e-05 | 4.37e-06 | 0.0001353 | 6.765e-06 | <frozen importlib._bootstrap_external>:91(_path_join) |
| 1 | 5.13e-05 | 5.13e-05 | 5.13e-05 | 5.13e-05 | ~:0(<built-in method io.open_code>) |
| 4 | 3.35e-05 | 8.375e-06 | 0.0003966 | 9.915e-05 | <frozen importlib._bootstrap_external>:1514(find_spec) |
| 1 | 3.14e-05 | 3.14e-05 | 3.14e-05 | 3.14e-05 | ~:0(<built-in method marshal.loads>) |
| 1 | 2.25e-05 | 2.25e-05 | 2.25e-05 | 2.25e-05 | ~:0(<method 'read' of '_io.BufferedReader' |
| - | - - - - | - - - | - - - | - - - | - - - |
| - | - - - - | - - - | - - - | - - - | - - - |
Using Py-Spy for Sampling Profiler:
py-spy is a sampling profiler for Python programs. It lets you visualize what your Python program is spending time on without restarting the program or modifying the code in any way. py-spy is extremely low overhead: it is written in Rust for speed and doesn't run in the same process as the profiled Python program. This means py-spy is safe to use against production Python code. (Source: https://github.com/benfred/py-spy)
To use Py-Spy, first, install it using pip:
pip install py-spy
Then, profile your Python script:
py-spy top -d 5 -p <PID>
Or
py-spy record -o profile.svg -- python myprogram.py
Replace <PID> with the process ID of your running Python script. Py-Spy will display the most time-consuming functions and their call stacks in real-time.