Create a dashboard with Python and Tkinter
Python tkinter layout management: Exercise-10 with Solution
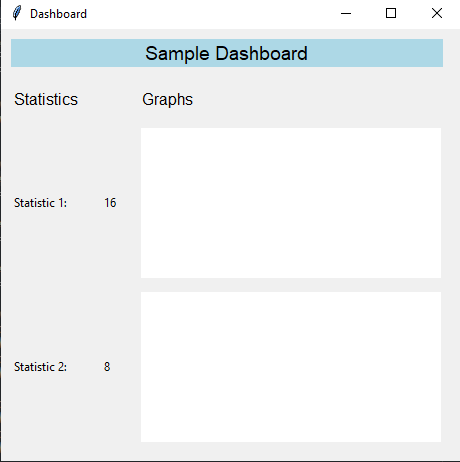
Write a Python program that implements a dashboard interface with multiple widgets, such as graphs and statistics. Use the Grid geometry manager to create a responsive layout.
Sample Solution:
Python Code:
import tkinter as tk
from tkinter import ttk
import random

class DashboardApp:
    def __init__(self, parent):
        self.parent = parent
        self.parent.title("Dashboard")

        # Create a Frame to hold the dashboard widgets
        self.dashboard_frame = ttk.Frame(parent)
        self.dashboard_frame.grid(sticky="nsew")

        # Create and place widgets on the dashboard using the Grid geometry manager
        self.create_widgets()

    def create_widgets(self):
        # Create and place labels
        label1 = tk.Label(self.dashboard_frame, text="Sample Dashboard", bg="lightblue", font=("Helvetica", 14))
        label1.grid(row=0, column=0, columnspan=3, padx=10, pady=10, sticky="nsew")

        label2 = tk.Label(self.dashboard_frame, text="Statistics", font=("Helvetica", 12))
        label2.grid(row=1, column=0, padx=10, pady=10, sticky="w")

        label3 = tk.Label(self.dashboard_frame, text="Graphs", font=("Helvetica", 12))
        label3.grid(row=1, column=2, padx=10, pady=10, sticky="w")

        # Create and place statistics widgets (placeholders)
        stat_label1 = tk.Label(self.dashboard_frame, text="Statistic 1:")
        stat_label1.grid(row=2, column=0, padx=10, pady=5, sticky="w")
        stat_value1 = tk.Label(self.dashboard_frame, text=str(random.randint(1, 100)))
        stat_value1.grid(row=2, column=1, padx=10, pady=5, sticky="w")

        stat_label2 = tk.Label(self.dashboard_frame, text="Statistic 2:")
        stat_label2.grid(row=3, column=0, padx=10, pady=5, sticky="w")
        stat_value2 = tk.Label(self.dashboard_frame, text=str(random.randint(1, 100)))
        stat_value2.grid(row=3, column=1, padx=10, pady=5, sticky="w")

        # Create and place graph widgets (placeholders)
        # You can use Matplotlib or other libraries for more advanced graphs
        graph1 = tk.Canvas(self.dashboard_frame, bg="white", width=300, height=150)
        graph1.grid(row=2, column=2, padx=10, pady=5, sticky="nsew")

        graph2 = tk.Canvas(self.dashboard_frame, bg="white", width=300, height=150)
        graph2.grid(row=3, column=2, padx=10, pady=5, sticky="nsew")

        # Configure grid layout weights to make the dashboard responsive
        self.dashboard_frame.columnconfigure(0, weight=1)
        self.dashboard_frame.columnconfigure(1, weight=1)
        self.dashboard_frame.columnconfigure(2, weight=1)
        self.dashboard_frame.rowconfigure(2, weight=1)
        self.dashboard_frame.rowconfigure(3, weight=1)

if __name__ == "__main__":
    parent = tk.Tk()
    app = DashboardApp(parent)
    parent.mainloop()
Explanation:
In the exercise above -
- We create a "DashboardApp" class to encapsulate the dashboard application.
- Grid geometry manager creates and places labels, statistics placeholders, and graph placeholders.
- Grid layouts are configured with weights to make the dashboard responsive to window resizing.
- Placeholder values for statistics and graphs are generated randomly. For more advanced graphing capabilities, you can replace these placeholders with real data and use libraries like Matplotlib.
Sample Output:
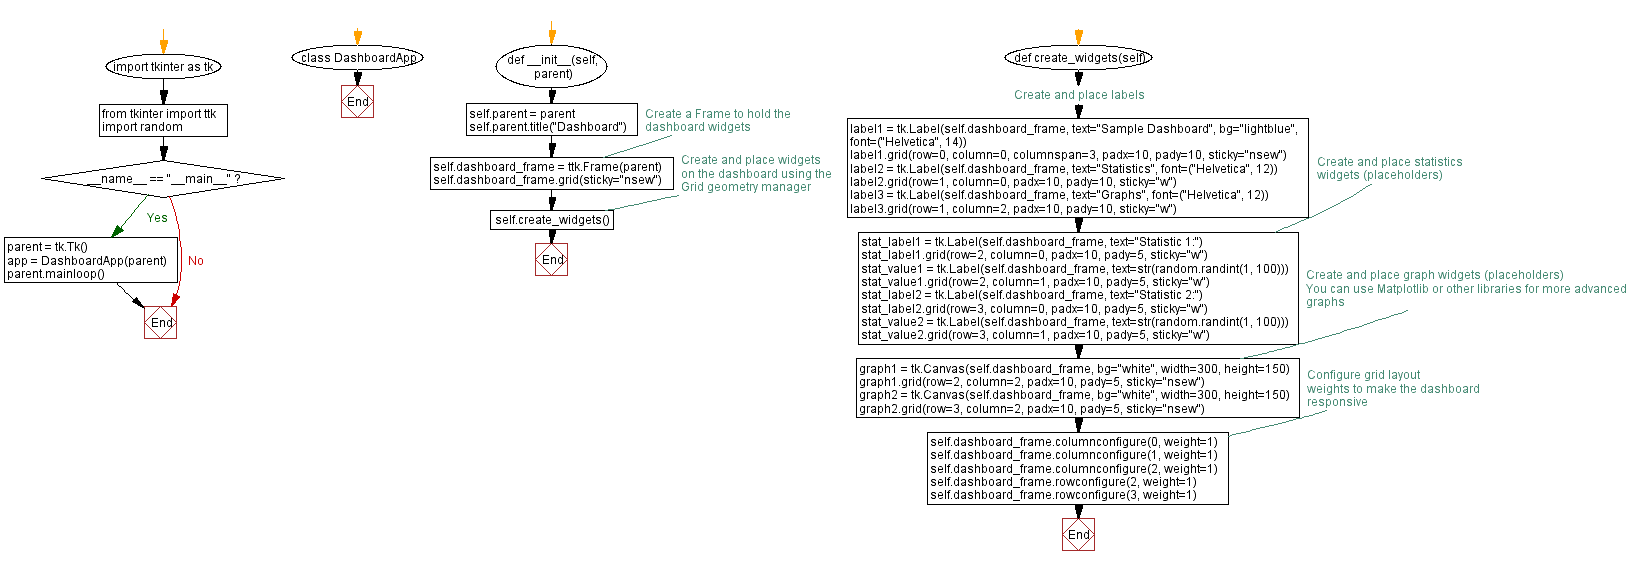
Flowchart:
Python Code Editor:
Previous: Create a contact information form with Python Tkinter.
Next: Create a Python Tkinter auditorium reservation system.
What is the difficulty level of this exercise?
Test your Programming skills with w3resource's quiz.
- Weekly Trends and Language Statistics
- Weekly Trends and Language Statistics