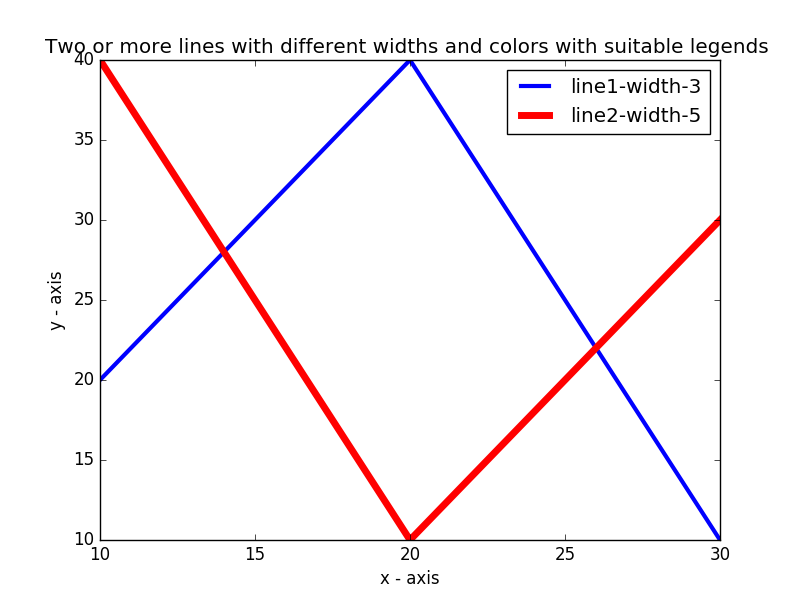
Matplotlib Basic: Plot two or more lines with legends, different widths and colors
Matplotlib Basic: Exercise-6 with Solution
Write a Python program to plot two or more lines with legends, different widths and colors.
Sample Solution:
Python Code:
import matplotlib.pyplot as plt
# line 1 points
x1 = [10,20,30]
y1 = [20,40,10]
# line 2 points
x2 = [10,20,30]
y2 = [40,10,30]
# Set the x axis label of the current axis.
plt.xlabel('x - axis')
# Set the y axis label of the current axis.
plt.ylabel('y - axis')
# Set a title
plt.title('Two or more lines with different widths and colors with suitable legends ')
# Display the figure.
plt.plot(x1,y1, color='blue', linewidth = 3,  label = 'line1-width-3')
plt.plot(x2,y2, color='red', linewidth = 5,  label = 'line2-width-5')
# show a legend on the plot
plt.legend()
plt.show()
Sample Output:

Go to:
PREV : Write a Python program to plot two or more lines on same plot with suitable legends of each line.
NEXT : Write a Python program to plot two or more lines with different styles.
Python Code Editor:
Contribute your code and comments through Disqus.
What is the difficulty level of this exercise?
