Excel 2013 - Basic
Introduction
Excel is an extremely powerful tool for manipulating a very large amount of data. It is really works well for any type of day to day simple calculations and tracking almost any kind of information. The unique future of excel is the grid of cells. Cells can contain numbers, text or formulas. You put data in your cells and group them in rows and columns. That allows you to add up your data, sort and filter it, put it in tables, and build great-looking charts. Let’s learn the basic steps to get you started.
Create a new workbook
Excel documents are called workbooks. Each workbook contains one or more sheets, typically called spreadsheets. You can add as many sheets as you want to a workbook, or you can create new workbooks to keep your data separate.
When you start excel first time (see the following picture) you can open existing workbook over here or start with a template. Since this is your first time click on the Blank workbook.
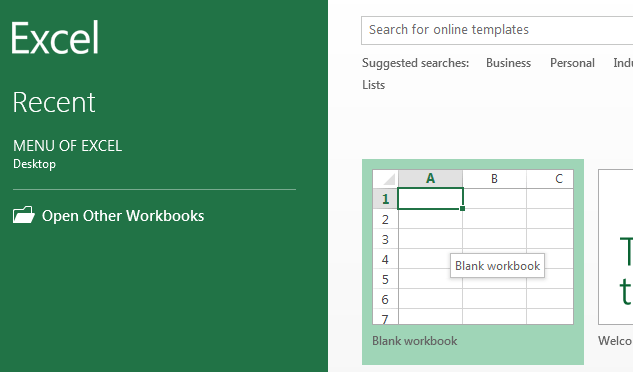
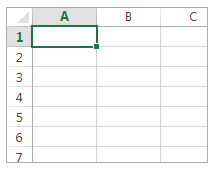
The area down here is where you create your worksheet.
Input your data
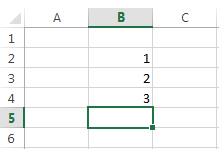
- Click an empty cell. For example, cell B2 on the below sheet.
- Type text or a number in the cell.
- Press Enter or Tab to move to the next cell.
Note : Cells are referenced by their location in the row and column on the sheet.
In the following workbook address of 1 is cell B2, 2 is cell B3, and 3 is cell B4.
Create a simple formula
Adding numbers is just one of the things you can do, but Excel can do other arithmetical formulas too. Here are some simple formulas to add, subtract, multiply or divide your numbers.
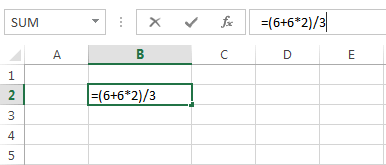
- Move the mouse in a cell and type an equal sign (=). That tells Excel that this cell will contain a formula.
- Type a combination of numbers and calculation operators, like the plus sign (+) for addition, the minus sign (-) for subtraction, the asterisk (*) for multiplication, or the forward slash (/) for the division.
For example =(6+6*2)/3
-
To execute the above formula Press Enter.
Note : To stay on the active cell Press Ctrl+Enter.
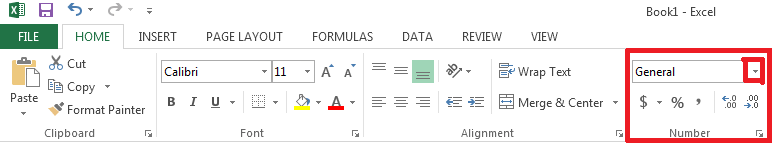
Apply a number format
To distinguish between different types of numbers, add a format, like currency, percentages, or dates.
- Select the cells that have numbers you want to format.
- Click Home tab --> General.
- Pick a number format
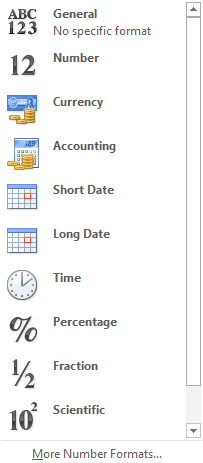
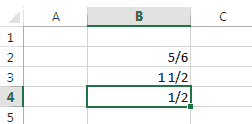
To write fraction number select "fraction". Here is a sample worksheet with some fraction number.
Add your data use AutoSum
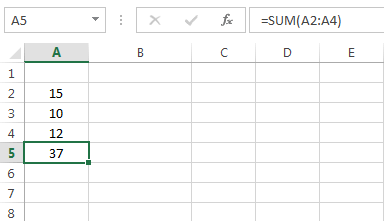
When you've entered numbers in your sheet, you can add them up to use a fast way that is AutoSum.
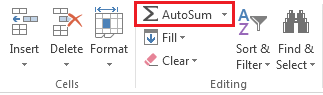
AutoSum adds up the numbers and shows the result in the cell you selected.
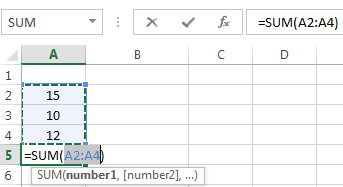
Press Enter to get desire result.
Put your data in a table
You can store a huge amount of data in a table. That lets you quickly filter or sort your data for starters.
- Select your data by clicking the first cell and dragging to the cell in your data.
To use the keyboard, hold down Shift while you press the arrow keys to select your data.
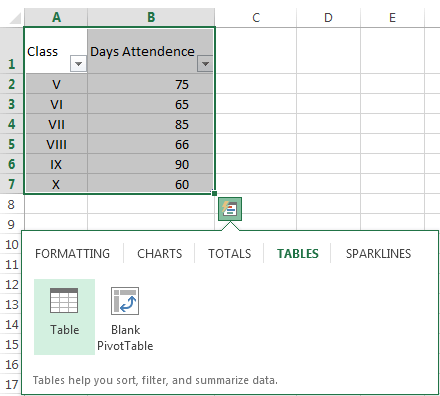
- Click the Quick Analysis button in the bottom-right corner of the selection.
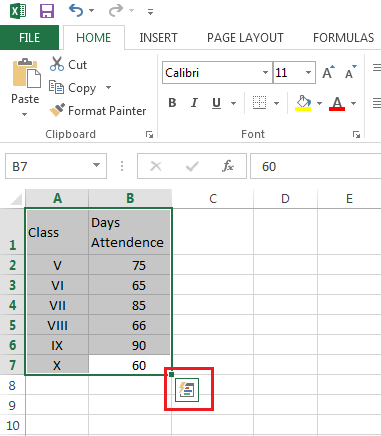
After clicking Quick Analysis we get the following menu then click on table button.
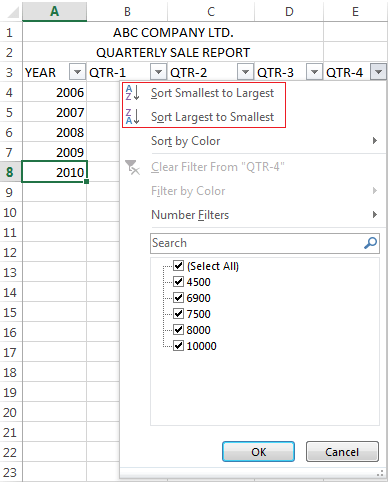
- To filter data, uncheck the Select All box to clear all check marks, and then check the boxes of the data you want to show in your table.
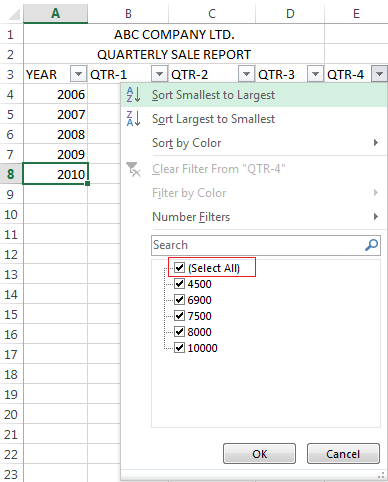
- To sort the data, click Sort A to Z or Sort Z to A.
Show totals for your numbers
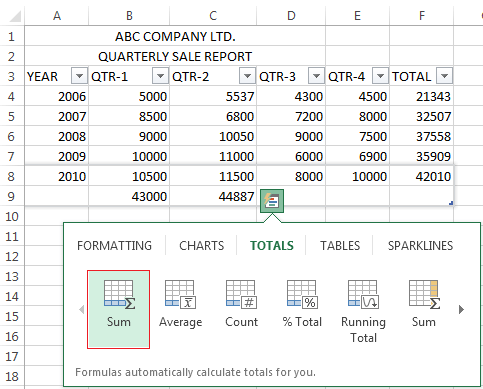
The Quick Analysis tools let you help to total your numbers quickly, that is the sum, average, or count whatever you want, see the picture below.
- Select the cells which contain numbers which you want to add or count.
- Click the Quick Analysis button in the right-bottom corner of the selection area.
- Then click the Total button or move your cursor across the Total button to see the calculation results for the data.
Add meaning to your data
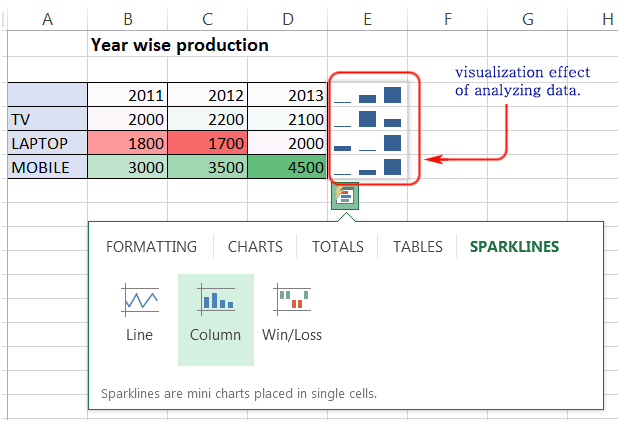
You can see the online preview of your most important data by using conditional formatting or sparklines which highlight your valuable data for better analyzing with visualization. You can use the Quick Analysis tool for a Live Preview to try it out.
Select the data you want for your analyzing.
Click the Quick Analysis button image that appears in the right-bottom corner of your selection, shown in the picture below.
Click on Analysis Tool and get the picture below.
Click on the Formatting tab and get the options shown below.
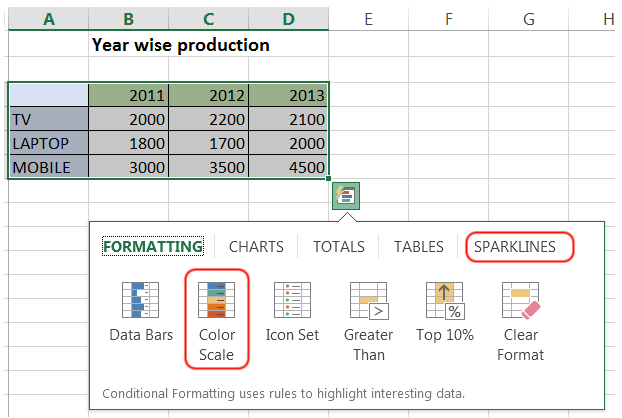
Now pick a color from Color Scale and click Sparklines and move the mouse pointer on the options and get an instant preview, shown below.
Show your data in a chart
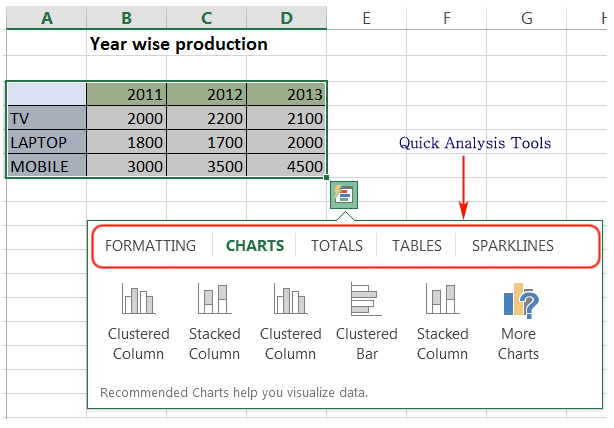
You can use your data to convert into a chart by using Quick Analysis tool for better visual presentation in just a few clicks.
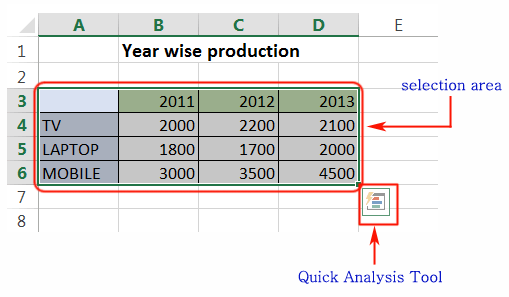
Select your data then quick analysis tool will appear at the right bottom corner of the selection area as shown in the picture below.
Click on Quick Analysis tool then click on Chart and move your mouse pointer on the recommended chart and see which one is your choice. See the picture below.
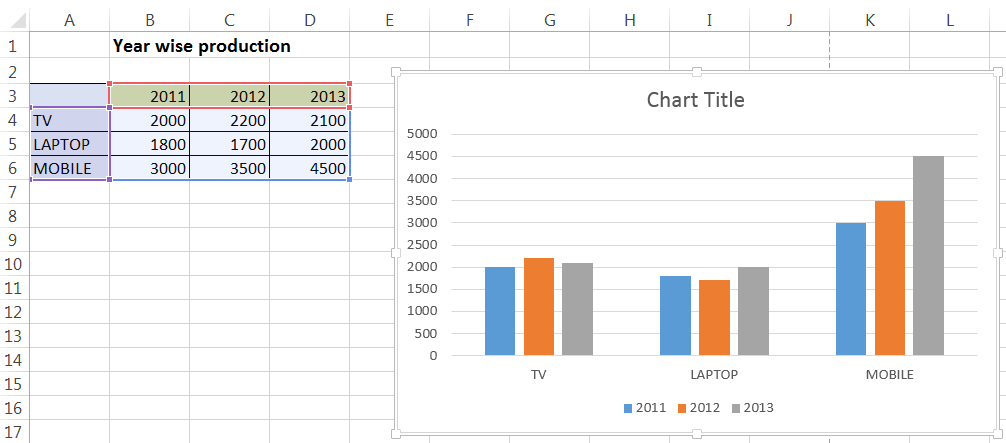
Click on your choice and the chart will appear in your data sheet as shown below.
Save
To save a file you can use the save button from the Quick Access Toolbar or press Ctrl+S. See the picture below.
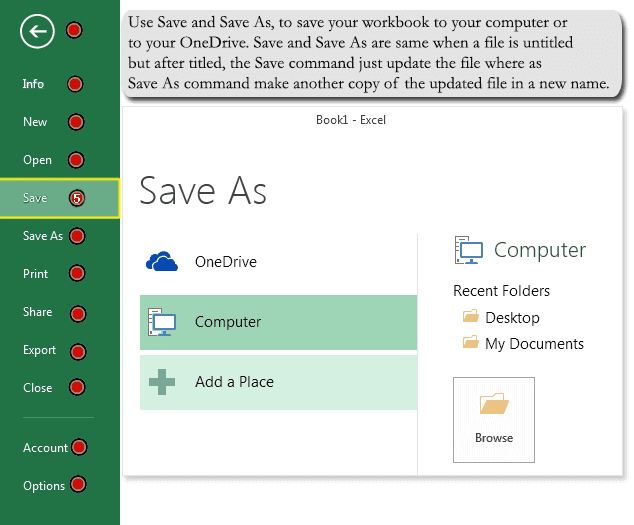
You can save the file in another way. Click File -- > Save and the following screen will appear.
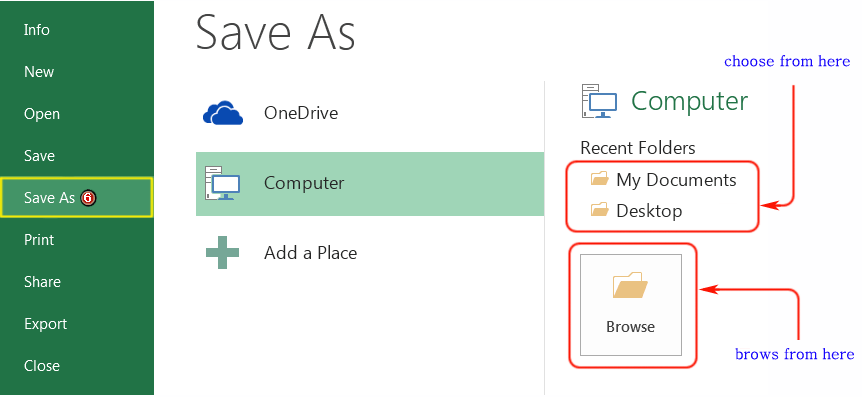
If you are saving the workbook first time the Save As window will appear and you can choose the default showing a folder for saving your workbook otherwise you can browse the folder where you want to save as shown in the above picture. Then in the file name box type the name of the file and click on Save button.
Click the File --> then click Print or press Ctrl+P from the keyboard the preview window will appear.
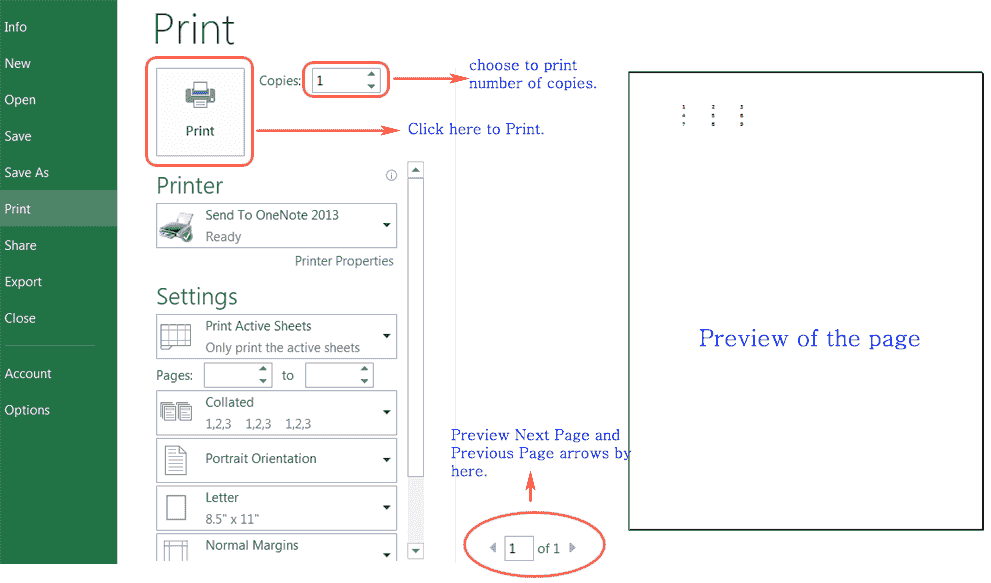
Print preview always appears in black and white format, it depends on the printer setting.
Page setting and printing setting can be changed by using other setting options.
Then click Print to print the page.