Matplotlib Pie Chart: Create a pie chart of the popularity of programming Languages
Matplotlib Pie Chart: Exercise-1 with Solution
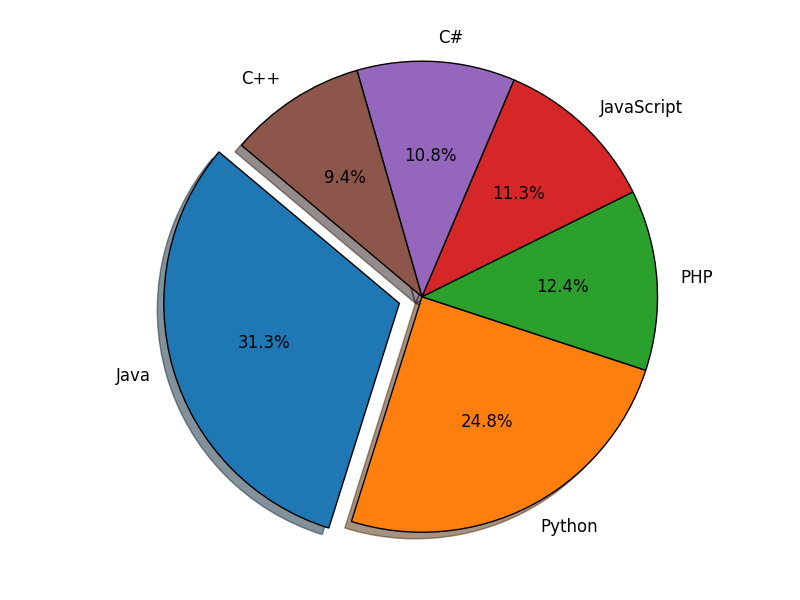
Write a Python programming to create a pie chart of the popularity of programming Languages.
Sample data:
Programming languages: Java, Python, PHP, JavaScript, C#, C++
Popularity: 22.2, 17.6, 8.8, 8, 7.7, 6.7
Sample Solution:
Python Code:
import matplotlib.pyplot as plt
# Data to plot
languages = 'Java', 'Python', 'PHP', 'JavaScript', 'C#', 'C++'
popuratity = [22.2, 17.6, 8.8, 8, 7.7, 6.7]
colors = ["#1f77b4", "#ff7f0e", "#2ca02c", "#d62728", "#9467bd", "#8c564b"]
# explode 1st slice
explode = (0.1, 0, 0, 0,0,0)
# Plot
plt.pie(popuratity, explode=explode, labels=languages, colors=colors,
autopct='%1.1f%%', shadow=True, startangle=140)

plt.axis('equal')
plt.show()
Sample Output:
Go to:
PREV : Matplotlib Pie Chart Exercises
NEXT : Write a Python programming to create a pie chart with a title of the popularity of programming Languages.
Python Code Editor:
Have another way to solve this solution? Contribute your code (and comments) through Disqus.
What is the difficulty level of this exercise?