Matplotlib Scatter: Draw a scatter graph taking a random distribution in X and Y
Matplotlib Scatter: Exercise-1 with Solution
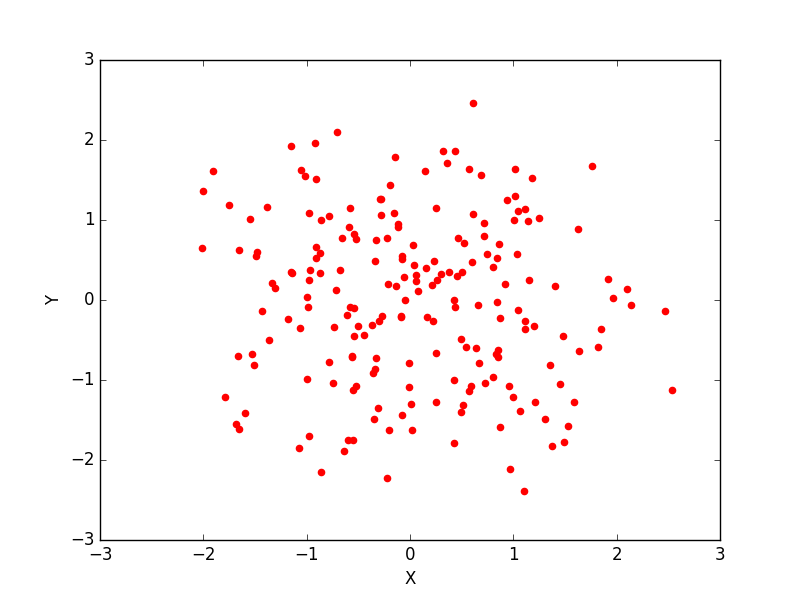
Write a Python program to draw a scatter graph taking a random distribution in X and Y and plotted against each other.
Sample Solution:
Python Code:
import matplotlib.pyplot as plt
from pylab import randn
X = randn(200)
Y = randn(200)
plt.scatter(X,Y, color='r')
plt.xlabel("X")
plt.ylabel("Y")
plt.show()
Sample Output:
Go to:
PREV : Matplotlib Scatter Plot Home.
NEXT : Write a Python program to draw a scatter plot with empty circles taking a random distribution in X and Y and plotted against each other.
Python Code Editor:
Contribute your code and comments through Disqus.
What is the difficulty level of this exercise?