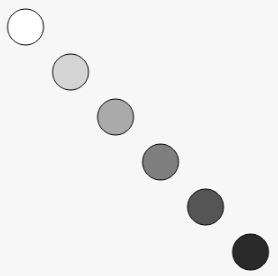
JavaScript: Draw a diagram with diagonal, white to black circles
JavaScript Drawing : Exercise-6 with Solution
Diagonal Gradient Circles
Write a JavaScript program to draw the following diagram [diagonal, white to black circles].
Sample output:

Sample Solution:
HTML Code:
<!DOCTYPE html>
  <html>
  <head>
  <title>Diagonal, White to Black circles</title>
  </head>
 <body>
  <canvas id="myCanvas" width="1500" height="800">
  <p>Update your browser!</p>
  </canvas>
  </body>
  </html>
JavaScript Code:
function draw()
  {
  var ctx = document.getElementById("myCanvas").getContext("2d");
  var counter = 0;
  for (var i=0;i<6;i++)
  {
  for (var j=0;j<6;j++)
  {
  //Start from white and goes to black
  ctx.fillStyle = "rgb(" + Math.floor(255-42.5*i) + "," + Math.floor(255-42.5*i) +
  "," + Math.floor(255-42.5*j) + ")";
ctx.beginPath();
  if (i === counter && j === counter)
  {
  //creates the circles
  ctx.arc(25+j*50,30+i*50,20,0,Math.PI*2,true);
  ctx.fill();
  //creates a border around the circles so white one will be vissible

  ctx.stroke();
  }
  }
  counter++;
  }
  }
  draw();
Live Demo:
See the Pen javascript-drawing-exercise-6 by w3resource (@w3resource) on CodePen.
For more Practice: Solve these Related Problems:
- Write a JavaScript program that draws a diagonal series of circles, gradually transitioning from white to black using dynamic color interpolation.
- Write a JavaScript program that creates a diagonal line of concentric circles with decreasing opacity from one end to the other.
- Write a JavaScript program that positions circles diagonally across the canvas with alternating white and black colors.
- Write a JavaScript program that animates a diagonal progression of circles, where each circle's size and shade gradually change from white to black.
Go to:
PREV : MoveTo Diagram.
NEXT : Javascript Object Exercises Home.
Improve this sample solution and post your code through Disqus.
What is the difficulty level of this exercise?
Test your Programming skills with w3resource's quiz.
