Python Scikit-learn: K Nearest Neighbors - Create a plot of k values vs accuracy
Python Machine learning K Nearest Neighbors: Exercise-8 with Solution
Write a Python program using Scikit-learn to split the iris dataset into 80% train data and 20% test data. Out of total 150 records, the training set will contain 120 records and the test set contains 30 of those records. Train or fit the data into the model and using the K Nearest Neighbor Algorithm and create a plot of k values vs accuracy.
Sample Solution:
Python Code:
# Import necessary modules
import pandas as pd
import matplotlib.pyplot as plt
import numpy as np
from sklearn.neighbors import KNeighborsClassifier
from sklearn.model_selection import train_test_split

iris = pd.read_csv("iris.csv")
#Drop id column
iris = iris.drop('Id',axis=1)
X = iris.iloc[:, :-1].values
y = iris.iloc[:, 4].values
#Split arrays or matrices into train and test subsets
X_train, X_test, y_train, y_test = train_test_split(X, y, test_size=0.20)
knn = KNeighborsClassifier(n_neighbors=7)
knn = KNeighborsClassifier(n_neighbors=6)
knn.fit(X_train,y_train)

print("Preliminary model score:")
print(knn.score(X_test,y_test))

no_neighbors = np.arange(1, 9)
train_accuracy = np.empty(len(no_neighbors))
test_accuracy = np.empty(len(no_neighbors))

for i, k in enumerate(no_neighbors):
    # We instantiate the classifier
    knn = KNeighborsClassifier(n_neighbors=k)
    # Fit the classifier to the training data
    knn.fit(X_train,y_train)

    # Compute accuracy on the training set
    train_accuracy[i] = knn.score(X_train, y_train)

    # Compute accuracy on the testing set
    test_accuracy[i] = knn.score(X_test, y_test)

# Visualization of k values vs accuracy

plt.title('k-NN: Varying Number of Neighbors')
plt.plot(no_neighbors, test_accuracy, label = 'Testing Accuracy')
plt.plot(no_neighbors, train_accuracy, label = 'Training Accuracy')
plt.legend()
plt.xlabel('Number of Neighbors')
plt.ylabel('Accuracy')
plt.show()
Sample Output:
Preliminary model score:
0.9666666666666667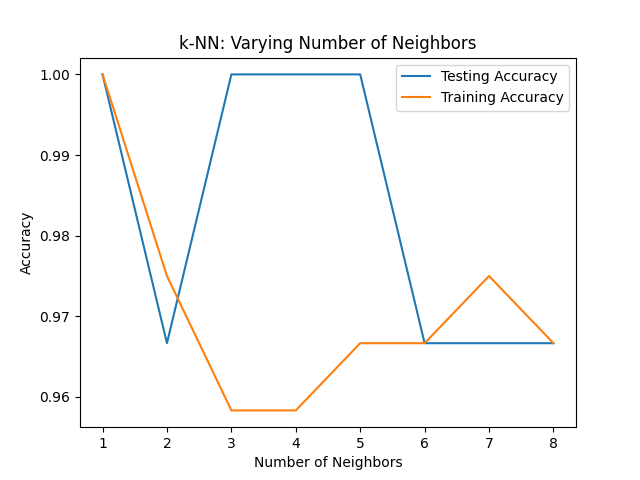
Go to:
Python Code Editor:
Have another way to solve this solution? Contribute your code (and comments) through Disqus.
What is the difficulty level of this exercise?