Python Scikit-learn: Create a hitmap using Seaborn to present their relations
Python Machine learning Iris Visualization: Exercise-14 with Solution
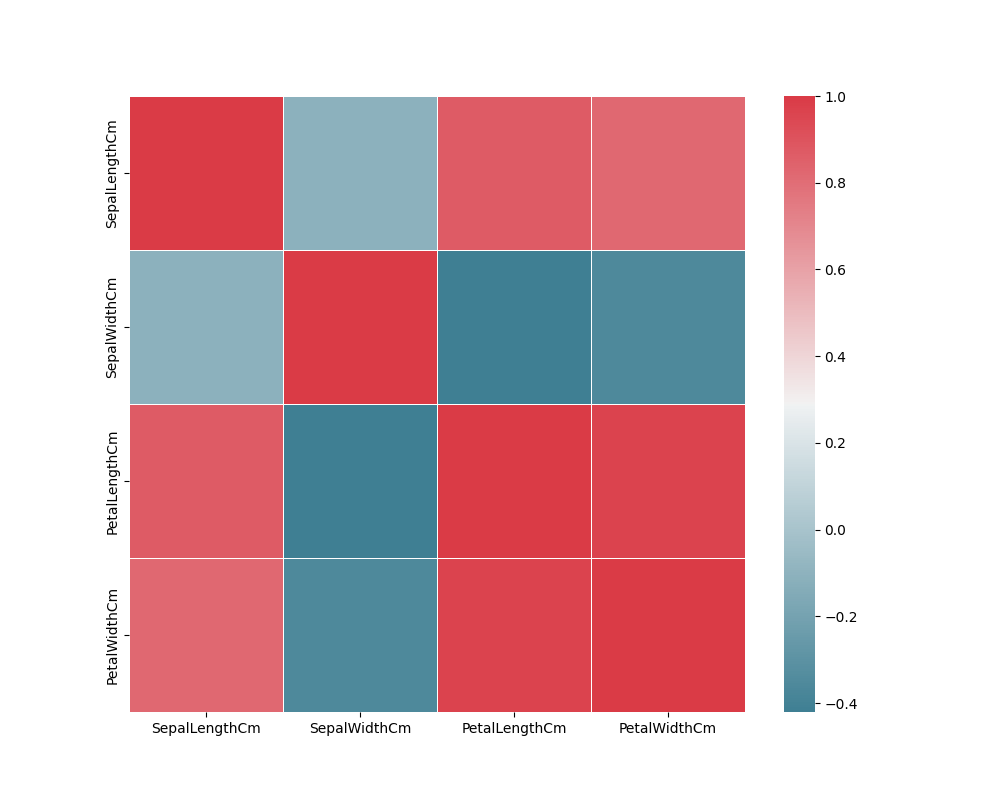
Write a Python program to find the correlation between variables of iris data. Also create a hitmap using Seaborn to present their relations.
Sample Solution:
Python Code:
import pandas as pd
import numpy as np
import matplotlib.pyplot as plt
import seaborn as sns
iris = pd.read_csv("iris.csv")
#Drop id column
iris = iris.drop('Id',axis=1)
X = iris.iloc[:, 0:4]
f, ax = plt.subplots(figsize=(10, 8))
corr = X.corr()
print(corr)
sns.heatmap(corr, mask=np.zeros_like(corr),
          cmap=sns.diverging_palette(220, 10, as_cmap=True),square=True, ax=ax, linewidths=.5)
plt.show()
Sample Output:
                SepalLengthCm  SepalWidthCm  PetalLengthCm  PetalWidthCm
SepalLengthCm       1.000000     -0.109369       0.871754      0.817954
SepalWidthCm       -0.109369      1.000000      -0.420516     -0.356544
PetalLengthCm       0.871754     -0.420516       1.000000      0.962757
PetalWidthCm        0.817954     -0.356544       0.962757      1.000000
Go to:
NEXT : Write a Python program to create a box plot (or box-and-whisker plot) which shows the distribution of quantitative data in a way that facilitates comparisons between variables or across levels of a categorical variable of iris dataset. Use seaborn.
Python Code Editor:
Have another way to solve this solution? Contribute your code (and comments) through Disqus.
What is the difficulty level of this exercise?