Python Scikit-learn: Create a scatter plot using sepal length and petal_width to separate the Species classes
Python Machine learning Logistic Regression: Exercise-2 with Solution
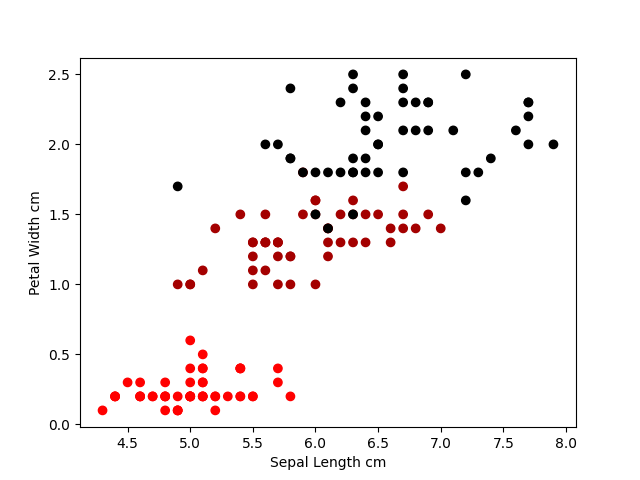
Write a Python program to create a scatter plot using sepal length and petal_width to separate the Species classes.
Sample Solution:
Python Code:
import pandas as pd
import matplotlib.pyplot as plt
from sklearn import preprocessing
iris = pd.read_csv("iris.csv")
#Drop id column
iris = iris.drop('Id',axis=1)
#Convert Species columns in a numerical column of the iris dataframe
#creating labelEncoder
le = preprocessing.LabelEncoder()
# Converting string labels into numbers.
iris.Species = le.fit_transform(iris.Species)
x = iris.iloc[:, :-1].values
y = iris.iloc[:, 4].values
plt.scatter(x[:,0], x[:, 3], c=y, cmap ='flag')
plt.xlabel('Sepal Length cm')
plt.ylabel('Petal Width cm')
plt.show()
Output:
Go to:
PREV : Write a Python program to view some basic statistical details like percentile, mean, std etc. of the species of ‘Iris-setosa’, ‘Iris-versicolor’ and ‘Iris-versicolor’.
NEXT : Write a Python program to create a Bar plot to get the frequency of the three species of the Iris data.
Python Code Editor:
Have another way to solve this solution? Contribute your code (and comments) through Disqus.
What is the difficulty level of this exercise?