NumPy: Compute the histogram of a set of data
Compute Histogram of Data
Write a NumPy program to compute the histogram of a set of data.
Sample Solution:
Python Code:
# Importing the NumPy library and aliasing it as 'np'
import numpy as np
# Importing the matplotlib.pyplot module and aliasing it as 'plt'
import matplotlib.pyplot as plt
# Creating a histogram using plt.hist()
# The histogram displays the frequency of occurrences of values in the input list [1, 2, 1]
# Bins are specified using the 'bins' parameter as [0, 1, 2, 3, 5]
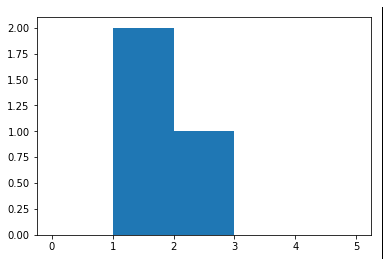
plt.hist([1, 2, 1], bins=[0, 1, 2, 3, 5])
# Displaying the histogram using plt.show()
plt.show()
Sample Output:
Explanation:
The above code creates a histogram using Matplotlib's plt.hist() function and displays it using plt.show().
plt.hist([1, 2, 1], bins=[0, 1, 2, 3, 5]): The plt.hist() function is called with the input data [1, 2, 1] and the specified bin edges [0, 1, 2, 3, 5]. This will create a histogram with four bins:
- Bin 2: 1 <= x < 2
- Bin 3: 2 <= x < 3
- Bin 4: 3 <= x < 5
The input data contains two occurrences of the value ‘1’ and one occurrence of the value ‘2’, so the histogram will have the following counts for each bin:
- Bin 1: 0
- Bin 2: 2
- Bin 3: 1
- Bin 4: 0
plt.show(): This line displays the histogram plot created by the plt.hist() function. The resulting plot will show the four bins on the x-axis and their corresponding counts on the y-axis.
For more Practice: Solve these Related Problems:
- Write a NumPy program to compute and plot the histogram of a random dataset using np.histogram.
- Create a function that returns both the histogram counts and bin edges for a given 1D array.
- Test the histogram computation on an array with a known distribution to verify the bin counts.
- Implement a solution that normalizes the histogram and compares it with a probability density function.
Go to:
PREV : Find Indices of Elements Equal to Zero
NEXT : Generate Line Graph of Data
Python-Numpy Code Editor:
Have another way to solve this solution? Contribute your code (and comments) through Disqus.What is the difficulty level of this exercise?
Test your Programming skills with w3resource's quiz.