Pandas Datetime: Create a graphical analysis of UFO sighted by month
21. Graphical Analysis of UFO Sightings by Month
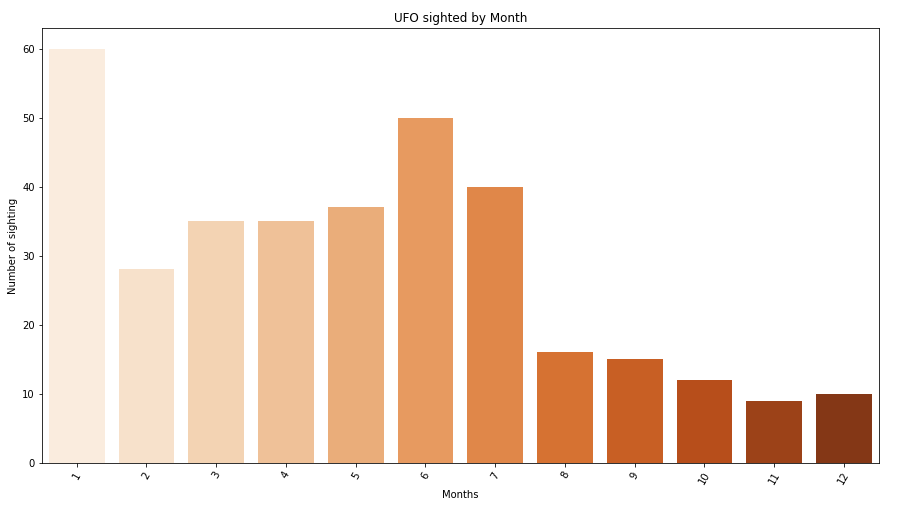
Write a Pandas program to create a graphical analysis of UFO (unidentified flying object) sighted by month.
Sample Solution:
Python Code:
import pandas as pd
import matplotlib.pyplot as plt
import seaborn as sns
df = pd.read_csv(r'ufo.csv')
df['Date_time'] = df['Date_time'].astype('datetime64[ns]')
df["ufo_yr"] = df.Date_time.dt.month
months_data = df.ufo_yr.value_counts()
months_index = months_data.index  # x ticks
months_values = months_data.get_values()
plt.figure(figsize=(15,8))
plt.xticks(rotation = 60)
plt.title('UFO sighted by Month')
plt.xlabel("Months")
plt.ylabel("Number of sighting")
months_plot = sns.barplot(x=months_index[:60],y=months_values[:60], palette = "Oranges")
Sample Output:
For more Practice: Solve these Related Problems:
- Write a Pandas program to group UFO sightings by month and create a pivot table that displays the count per month, then plot the results.
- Write a Pandas program to extract the month from the UFO reporting dates and plot a bar chart of sightings per month.
- Write a Pandas program to create a line plot that illustrates seasonal trends in UFO sightings using monthly grouping.
- Write a Pandas program to generate a heatmap of UFO sighting frequencies by month and compare seasonal variations.
Go to:
PREV : Plot Distribution of UFO Observation Time.
NEXT : Top 10 UFO Years vs. Hours of the Day.
Python Code Editor:
Have another way to solve this solution? Contribute your code (and comments) through Disqus.
What is the difficulty level of this exercise?