Pandas Datetime: Create a plot to present the number of unidentified flying object (UFO) reports per year
7. Plot UFO Reports Per Year
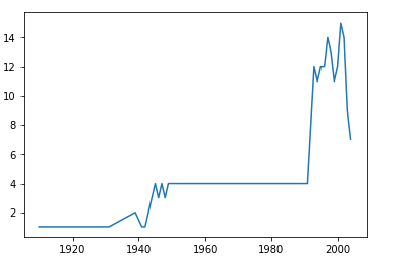
Write a Pandas program to create a plot to present the number of unidentified flying object (UFO) reports per year.
Sample Solution :
Python Code :
import pandas as pd
df = pd.read_csv(r'ufo.csv')
df['Date_time'] = df['Date_time'].astype('datetime64[ns]')
print("Original Dataframe:")
print(df.head())
print("\nPlot to present the number unidentified flying objects (ufo) found year wise:")
df["Year"] = df.Date_time.dt.year
df.Year.value_counts().sort_index().plot(x="Year")
Sample Output:
Original Dataframe:
            Date_time                  city     ...       latitude   longitude
0 1910-06-01 15:00:00           wills point     ...      32.709167  -96.008056
1 1920-06-11 21:00:00                cicero     ...      40.123889  -86.013333
2 1929-07-05 14:00:00  buchanan  (or burns)     ...      43.642500 -118.627500
3 1931-06-01 13:00:00               abilene     ...      38.917222  -97.213611
4 1939-06-01 20:00:00              waterloo     ...      34.918056  -88.064167

[5 rows x 11 columns]

Plot to present the number unidentified flying objects (ufo) found year wise:
For more Practice: Solve these Related Problems:
- Write a Pandas program to group UFO sightings by year and plot a bar chart showing the number of reports per year.
- Write a Pandas program to create a pivot table of UFO sighting counts per year and then visualize it using a line plot.
- Write a Pandas program to extract year information from UFO sightings and generate a histogram of report frequencies per year.
- Write a Pandas program to create a time series plot of the annual UFO sighting counts from the dataset.
Go to:
PREV : Extract UFO Sighting Years.
NEXT : Extract Date Components from UFO Reporting Date.
Python Code Editor:
Have another way to solve this solution? Contribute your code (and comments) through Disqus.
What is the difficulty level of this exercise?