Pandas styling Exercises: Write a Pandas program to display bar charts in dataframe on specified columns
15. Display Bar Charts in DataFrame on Specified Columns
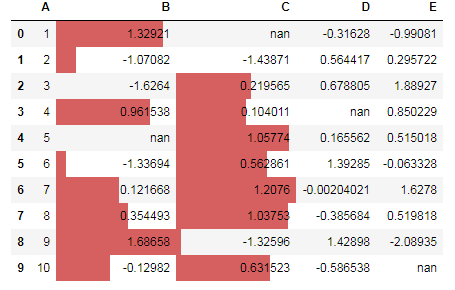
Create a dataframe of ten rows, four columns with random values. Write a Pandas program to display bar charts in dataframe on specified columns.
Sample Solution :
Python Code :
import pandas as pd
import numpy as np
np.random.seed(24)
df = pd.DataFrame({'A': np.linspace(1, 10, 10)})
df = pd.concat([df, pd.DataFrame(np.random.randn(10, 4), columns=list('BCDE'))],
               axis=1)
df.iloc[0, 2] = np.nan
df.iloc[3, 3] = np.nan
df.iloc[4, 1] = np.nan
df.iloc[9, 4] = np.nan
print("Original array:")
print(df)
print("\nBar charts in dataframe:")
df.style.bar(subset=['B', 'C'], color='#d65f5f')
Original array:
Original array:
      A         B         C         D         E
0   1.0  1.329212       NaN -0.316280 -0.990810
1   2.0 -1.070816 -1.438713  0.564417  0.295722
2   3.0 -1.626404  0.219565  0.678805  1.889273
3   4.0  0.961538  0.104011       NaN  0.850229
4   5.0       NaN  1.057737  0.165562  0.515018
5   6.0 -1.336936  0.562861  1.392855 -0.063328
6   7.0  0.121668  1.207603 -0.002040  1.627796
7   8.0  0.354493  1.037528 -0.385684  0.519818
8   9.0  1.686583 -1.325963  1.428984 -2.089354
9  10.0 -0.129820  0.631523 -0.586538       NaN

Bar charts in dataframe:
Sample Output:
Download the Jupyter Notebook from here.
For more Practice: Solve these Related Problems:
- Write a Pandas program to render a dataframe with embedded bar charts on a specified numeric column using bar() styling.
- Write a Pandas program to display horizontal bar charts within dataframe cells for selected columns.
- Write a Pandas program to create a styled dataframe where one column’s values are represented as inline bar charts.
- Write a Pandas program to use the bar() function to visually represent data in a specified column as part of the dataframe display.
Go to:
PREV : Display DataFrame in Table Style with Outer Border.
NEXT : Pandas Excel Exercises Home.
Python Code Editor:
Have another way to solve this solution? Contribute your code (and comments) through Disqus.
What is the difficulty level of this exercise?