Resampling Time-Series in a Pandas DataFrame
Resample time-series data in a DataFrame.
Sample Solution:
Python Code:
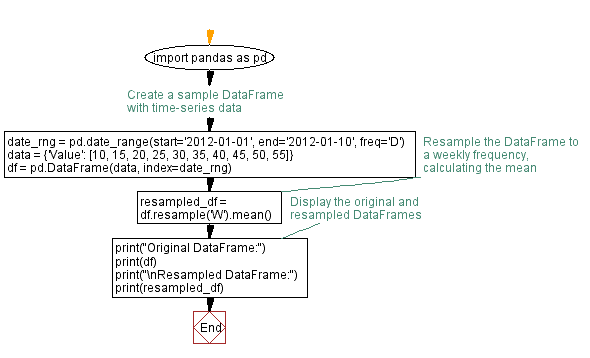
import pandas as pd

# Create a sample DataFrame with time-series data
date_rng = pd.date_range(start='2012-01-01', end='2012-01-10', freq='D')
data = {'Value': [10, 15, 20, 25, 30, 35, 40, 45, 50, 55]}
df = pd.DataFrame(data, index=date_rng)

# Resample the DataFrame to a weekly frequency, calculating the mean
resampled_df = df.resample('W').mean()

# Display the original and resampled DataFrames
print("Original DataFrame:")
print(df)
print("\nResampled DataFrame:")
print(resampled_df)
Output:
Original DataFrame:
            Value
2012-01-01     10
2012-01-02     15
2012-01-03     20
2012-01-04     25
2012-01-05     30
2012-01-06     35
2012-01-07     40
2012-01-08     45
2012-01-09     50
2012-01-10     55

Resampled DataFrame:
            Value
2012-01-01   10.0
2012-01-08   30.0
2012-01-15   52.5
Explanation:
Here's a breakdown of the above code:
- We create a sample DataFrame (df) with time-series data using the pd.date_range() function.
- The DataFrame has a daily frequency with values in the 'Value' column.
- The df.resample('W').mean() line resamples the DataFrame to a weekly frequency ('W') and calculates the mean of each weekly period.
- The resulting "resampled_df" DataFrame contains the resampled data.
Flowchart:
Python Code Editor:
Previous: Extracting date and time from Pandas DateTime.
Next: Rolling Calculation in Pandas DataFrame.
What is the difficulty level of this exercise?
Test your Programming skills with w3resource's quiz.