Matplotlib Pie Chart: Create a pie chart using the data from a csv file
Matplotlib Pie Chart: Exercise-4 with Solution
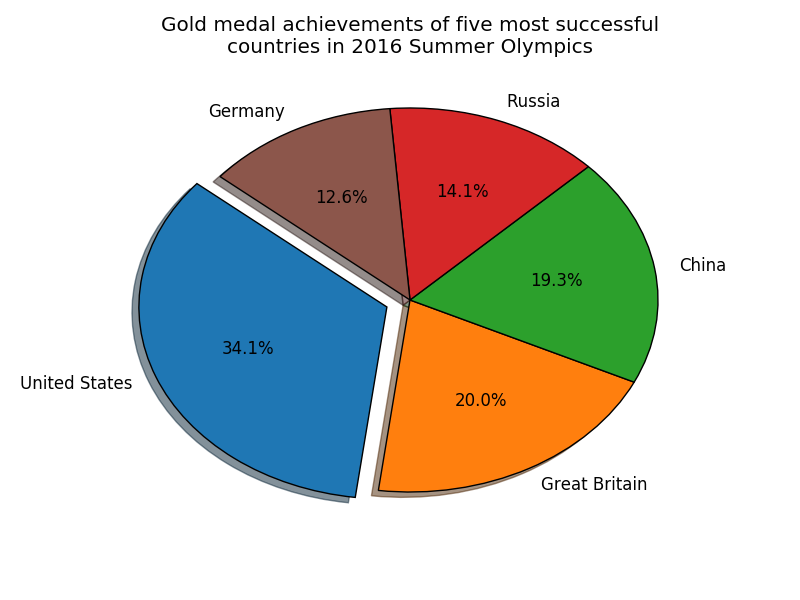
Write a Python programming to create a pie chart of gold medal achievements of five most successful countries in 2016 Summer Olympics. Read the data from a csv file.
Sample data:
medal.csv
country,gold_medal
United States,46
Great Britain,27
China,26
Russia,19
Germany,17
Sample Solution:
Python Code:
import matplotlib.pyplot as plt
import pandas as pd
df =  pd.read_csv('medal.csv')
country_data = df["country"]
medal_data = df["gold_medal"]
colors = ["#1f77b4", "#ff7f0e", "#2ca02c", "#d62728", "#8c564b"]
explode = (0.1, 0, 0, 0, 0)
plt.pie(medal_data, labels=country_data, explode=explode, colors=colors,
autopct='%1.1f%%', shadow=True, startangle=140)
plt.title("Gold medal achievements of five most successful\n"+"countries in 2016 Summer Olympics")
plt.show()
Sample Output:

Go to:
PREV : Write a Python programming to create a pie chart with a title of the popularity of programming Languages. Make multiple wedges of the pie.
NEXT : Matplotlib Scatter Plot Exercises
Python Code Editor:
Have another way to solve this solution? Contribute your code (and comments) through Disqus.
What is the difficulty level of this exercise?
