Matplotlib Scatter Plot: Exercises, Practice, Solution
Matplotlib Scatter Plot[6 exercises with solution]
[An editor is available at the bottom of the page to write and execute the scripts. Go to the editor]
What is Scatter Plot?
From Wikipedia:
A scatter plot (also called a scatterplot, scatter graph, scatter chart, scattergram, or scatter diagram)[3] is a type of plot or mathematical diagram using Cartesian coordinates to display values for typically two variables for a set of data. If the points are color-coded, one additional variable can be displayed. The data are displayed as a collection of points, each having the value of one variable determining the position on the horizontal axis and the value of the other variable determining the position on the vertical axis.[4]
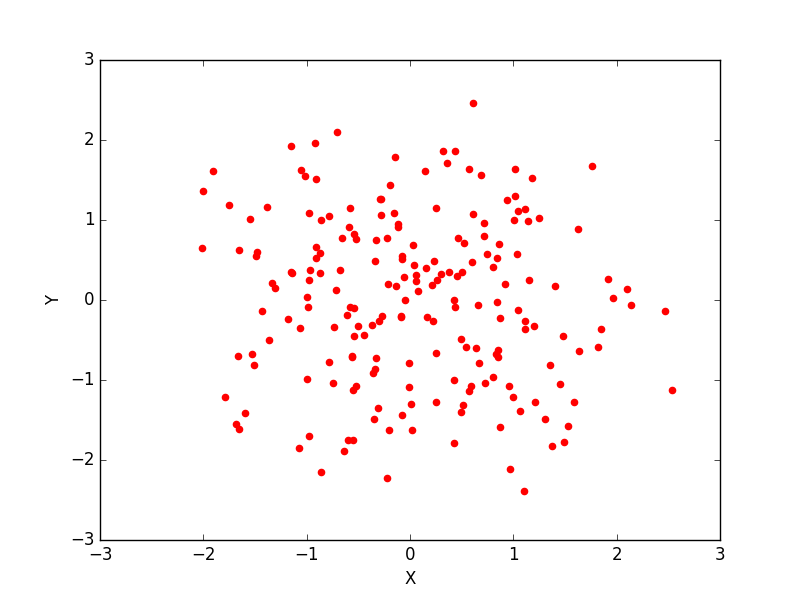
1. Write a Python program to draw a scatter graph taking a random distribution in X and Y and plotted against each other.
The code snippet gives the output shown in the following screenshot:
Click me to see the sample solution
2. Write a Python program to draw a scatter plot with empty circles taking a random distribution in X and Y and plotted against each other.
The code snippet gives the output shown in the following screenshot:

Click me to see the sample solution
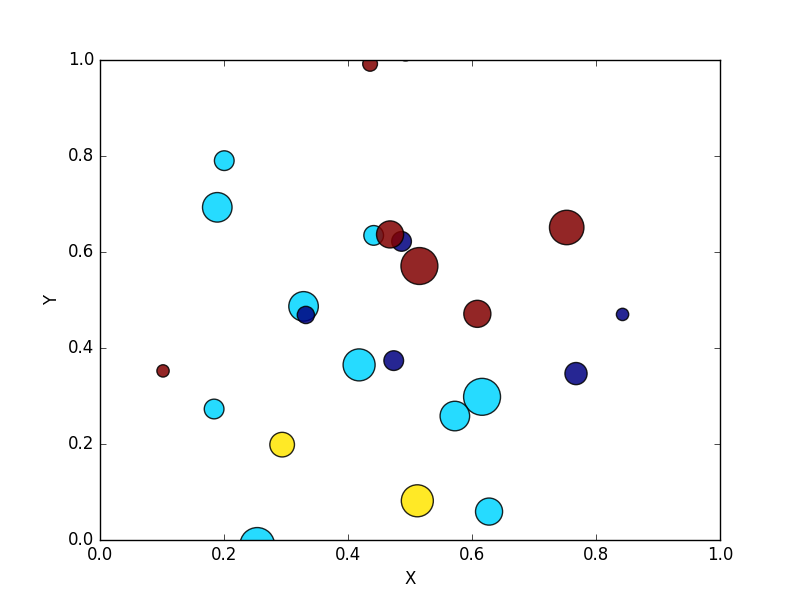
3. Write a Python program to draw a scatter plot using random distributions to generate balls of different sizes.
The code snippet gives the output shown in the following screenshot:
Click me to see the sample solution
4. Write a Python program to draw a scatter plot comparing two subject marks of Mathematics and Science. Use marks of 10 students.
Sample data:
Test Data:
math_marks = [88, 92, 80, 89, 100, 80, 60, 100, 80, 34]
science_marks = [35, 79, 79, 48, 100, 88, 32, 45, 20, 30]
marks_range = [10, 20, 30, 40, 50, 60, 70, 80, 90, 100]

Click me to see the sample solution
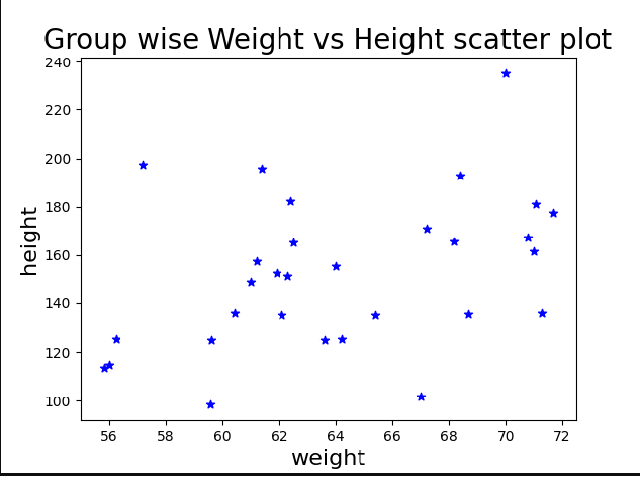
5. Write a Python program to draw a scatter plot for three different groups comparing weights and heights.
The code snippet gives the output shown in the following screenshot:
Click me to see the sample solution
5. Write a Python program to draw a scatter plot for three different groups camparing weights and heights.
The code snippet gives the output shown in the following screenshot:
Click me to see the sample solution
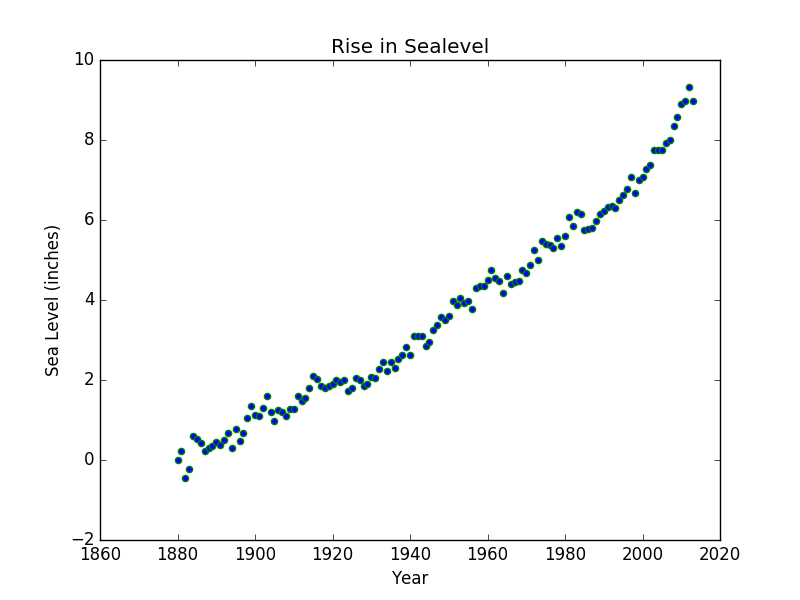
6. Write a Python program to draw a scatter plot to find sea level rise in past 100 years.
The code snippet gives the output shown in the following screenshot:
Click me to see the sample solution
Python Code Editor:
More to Come !
Do not submit any solution of the above exercises at here, if you want to contribute go to the appropriate exercise page.