Matplotlib Scatter: Draw a scatter plot to find sea level rise in past 100 years
Matplotlib Scatter: Exercise-6 with Solution
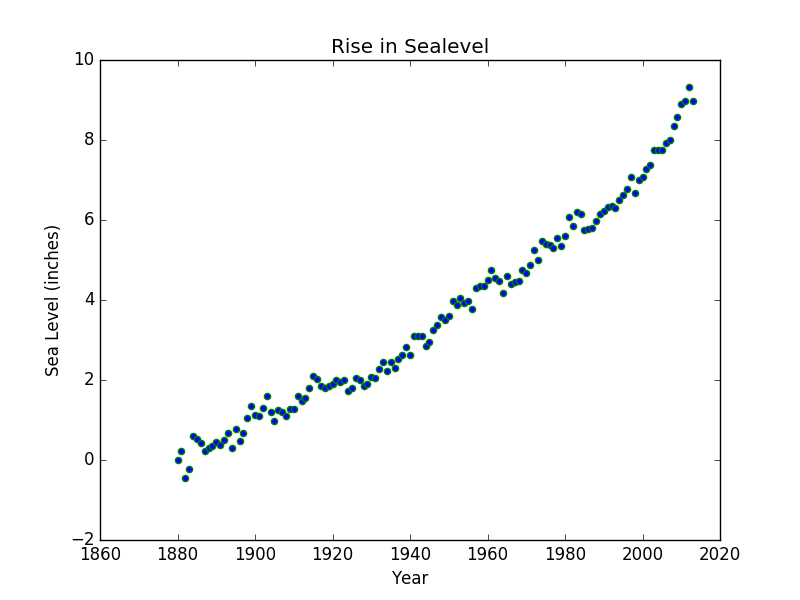
Write a Python program to draw a scatter plot to find sea level rise in past 100 years. We have collected the data from here [https://github.com/datasets/sea-level-rise].
This data contains "cumulative changes in sea level for the world’s oceans since 1880, based on a combination of long-term tide gauge measurements and recent satellite measurements. It shows average absolute sea level change, which refers to the height of the ocean surface, regardless of whether nearby land is rising or falling. Satellite data are based solely on measured sea level, while the long-term tide gauge data include a small correction factor because the size and shape of the oceans are changing slowly over time. (On average, the ocean floor has been gradually sinking since the last Ice Age peak, 20,000 years ago.)"
Sample Data:
data.csv
Sample Solution:
Python Code:
import matplotlib.pyplot as plt
import pandas as pd
data = pd.read_csv('data.csv')
year = data['year']
sea_levels = data['CSIRO_sea_level']
plt.scatter(year, sea_levels, edgecolors='g')
plt.xlabel('Year')
plt.ylabel('Sea Level (inches)')
plt.title('Rise in Sealevel')
plt.show()
Sample Output:
Go to:
PREV : Write a Python program to draw a scatter plot for three different groups comparing weights and heights.
NEXT : Matplotlib Exercises
Python Code Editor:
Contribute your code and comments through Disqus.
What is the difficulty level of this exercise?