Matplotlib Scatter: Draw a scatter plot for three different groups comparing weights and heights
Matplotlib Scatter: Exercise-5 with Solution
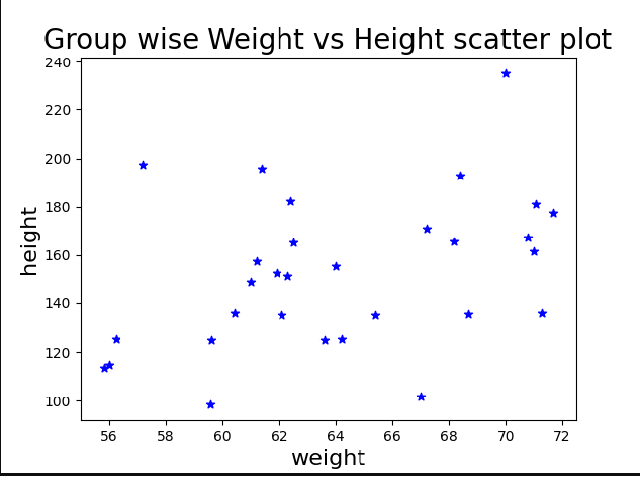
Write a Python program to draw a scatter plot for three different groups comparing weights and heights.
Sample Solution:
Python Code:
import matplotlib.pyplot as plt
import numpy as np
weight1=[67,57.2,59.6,59.64,55.8,61.2,60.45,61,56.23,56]
height1=[101.7,197.6,98.3,125.1,113.7,157.7,136,148.9,125.3,114.9]
weight2=[61.9,64,62.1,64.2,62.3,65.4,62.4,61.4,62.5,63.6]
height2=[152.8,155.3,135.1,125.2,151.3,135,182.2,195.9,165.1,125.1]
weight3=[68.2,67.2,68.4,68.7,71,71.3,70.8,70,71.1,71.7]
height3=[165.8,170.9,192.8,135.4,161.4,136.1,167.1,235.1,181.1,177.3]
weight=np.concatenate((weight1,weight2,weight3))
height=np.concatenate((height1,height2,height3))
plt.scatter(weight, height, marker='*', color=['blue'])
plt.xlabel('weight', fontsize=16)
plt.ylabel('height', fontsize=16)
plt.title('Group wise Weight vs Height scatter plot',fontsize=20)
plt.show()
Sample Output:
Go to:
PREV : Write a Python program to draw a scatter plot comparing two subject marks of Mathematics and Science. Use marks of 10 students.
NEXT : Write a Python program to draw a scatter plot for three different groups camparing weights and heights
Python Code Editor:
Contribute your code and comments through Disqus.
What is the difficulty level of this exercise?