Matplotlib Barchart: Exercises, Practice, Solution
Matplotlib Barchart [17 exercises with solution]
[An editor is available at the bottom of the page to write and execute the scripts. Go to the editor]
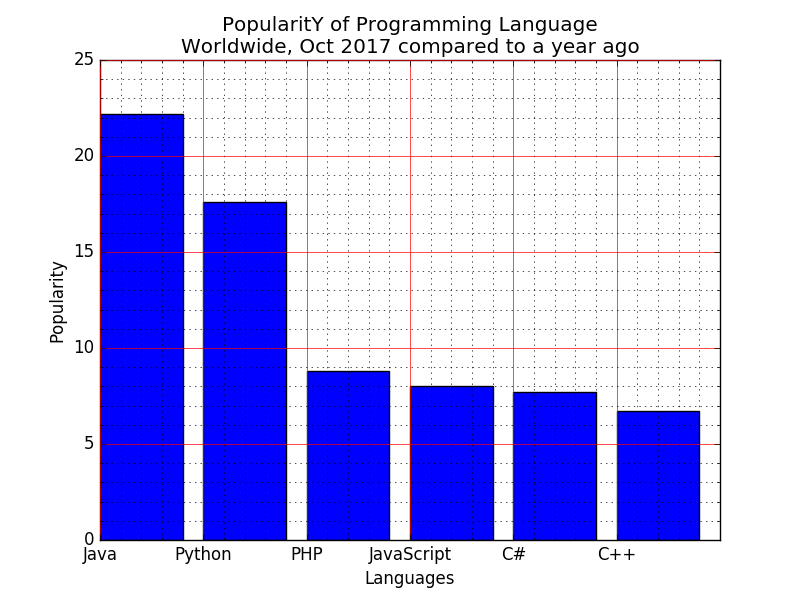
1. Write a Python programming to display a bar chart of the popularity of programming Languages.
Sample data:
Programming languages: Java, Python, PHP, JavaScript, C#, C++
Popularity: 22.2, 17.6, 8.8, 8, 7.7, 6.7
The code snippet gives the output shown in the following screenshot:
Click me to see the sample solution
2. Write a Python programming to display a horizontal bar chart of the popularity of programming Languages.
Sample data:
Programming languages: Java, Python, PHP, JavaScript, C#, C++
Popularity: 22.2, 17.6, 8.8, 8, 7.7, 6.7
The code snippet gives the output shown in the following screenshot:

Click me to see the sample solution
3. Write a Python programming to display a bar chart of the popularity of programming Languages. Use uniform color.
Sample data:
Programming languages: Java, Python, PHP, JavaScript, C#, C++
Popularity: 22.2, 17.6, 8.8, 8, 7.7, 6.7
The code snippet gives the output shown in the following screenshot:

Click me to see the sample solution
4. Write a Python programming to display a bar chart of the popularity of programming Languages. Use different color for each bar.
Sample data:
Programming languages: Java, Python, PHP, JavaScript, C#, C++
Popularity: 22.2, 17.6, 8.8, 8, 7.7, 6.7

Click me to see the sample solution
5. Write a Python programming to display a bar chart of the popularity of programming Languages. Attach a text label above each bar displaying its popularity (float value).
Sample data:
Programming languages: Java, Python, PHP, JavaScript, C#, C++
Popularity: 22.2, 17.6, 8.8, 8, 7.7, 6.7
The code snippet gives the output shown in the following screenshot:

Click me to see the sample solution
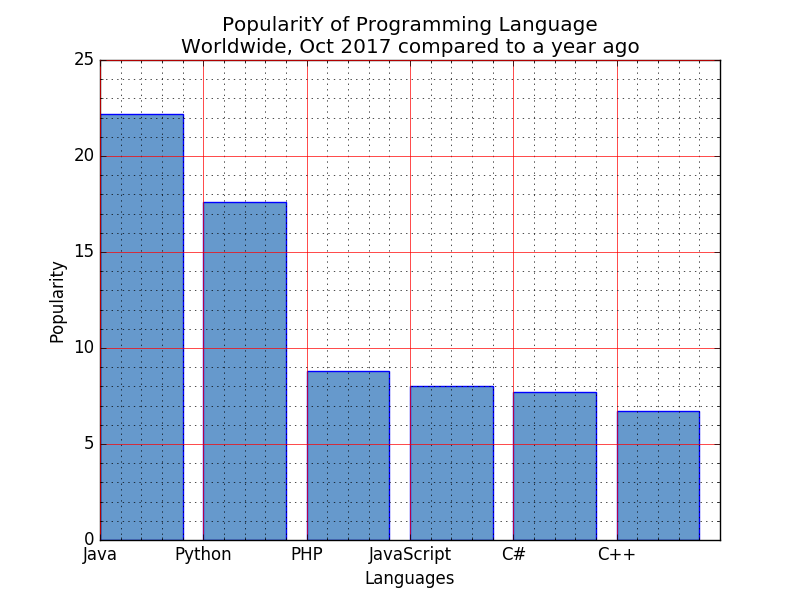
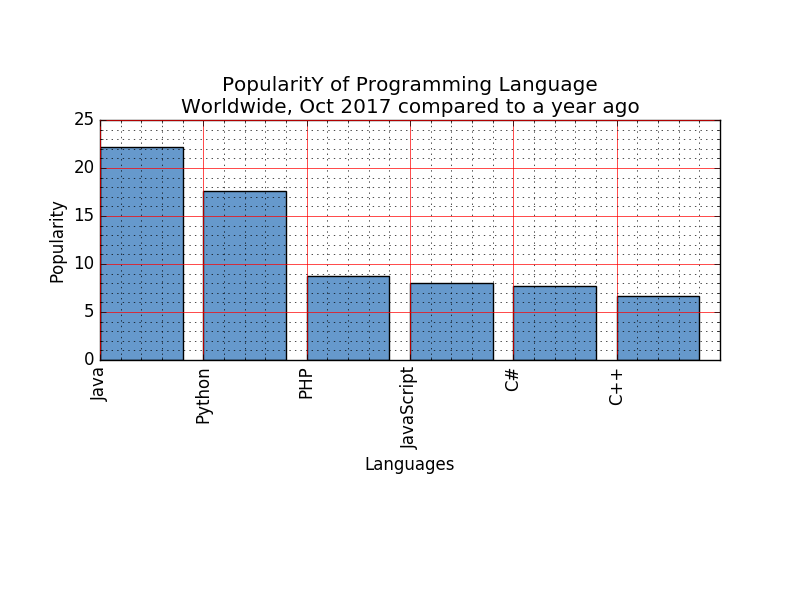
6. Write a Python programming to display a bar chart of the popularity of programming Languages. Make blue border to each bar.
Sample data:
Programming languages: Java, Python, PHP, JavaScript, C#, C++
Popularity: 22.2, 17.6, 8.8, 8, 7.7, 6.7
The code snippet gives the output shown in the following screenshot:
Click me to see the sample solution
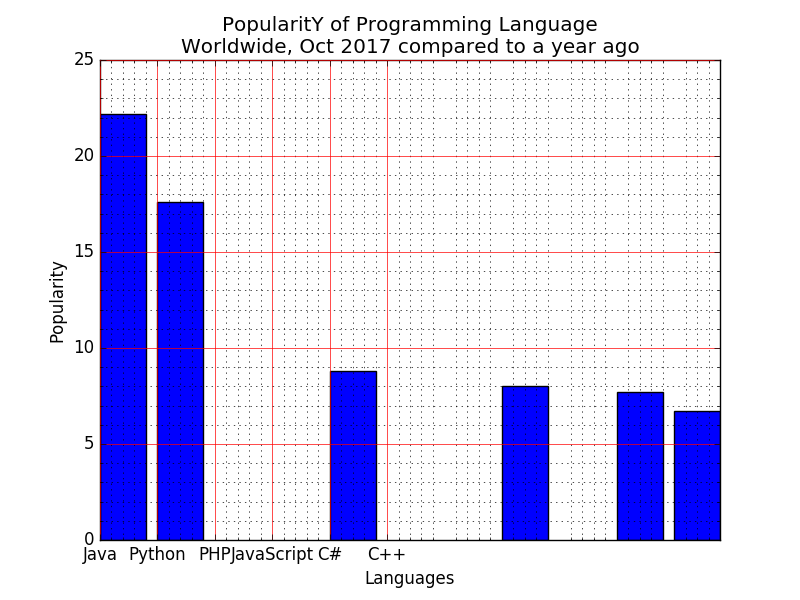
7. Write a Python programming to display a bar chart of the popularity of programming Languages. Specify the position of each bar plot.
Sample data:
Programming languages: Java, Python, PHP, JavaScript, C#, C++
Popularity: 22.2, 17.6, 8.8, 8, 7.7, 6.7
The code snippet gives the output shown in the following screenshot:
Click me to see the sample solution
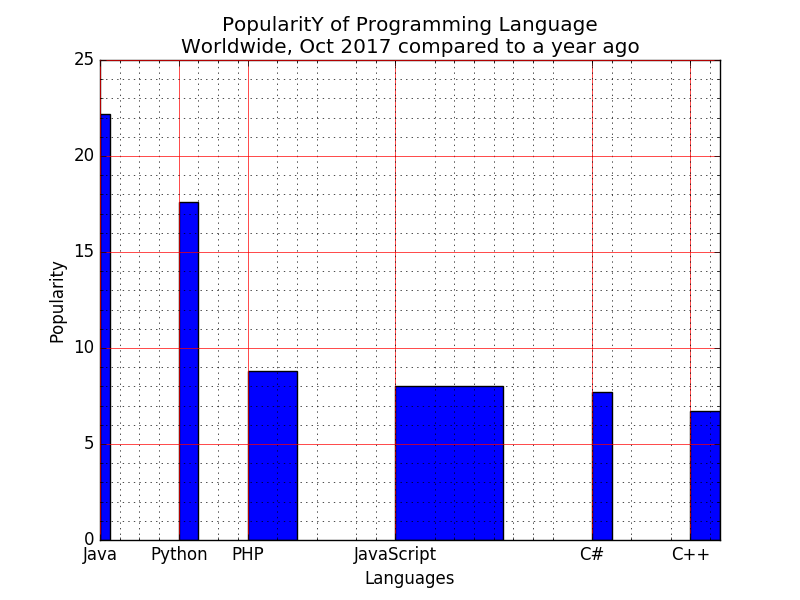
8. Write a Python programming to display a bar chart of the popularity of programming Languages. Select the width of each bar and their positions.
Sample data:
Programming languages: Java, Python, PHP, JavaScript, C#, C++
Popularity: 22.2, 17.6, 8.8, 8, 7.7, 6.7
The code snippet gives the output shown in the following screenshot:
Click me to see the sample solution
9. Write a Python programming to display a bar chart of the popularity of programming Languages. Increase bottom margin.
Sample data:
Programming languages: Java, Python, PHP, JavaScript, C#, C++
Popularity: 22.2, 17.6, 8.8, 8, 7.7, 6.7
The code snippet gives the output shown in the following screenshot:
Click me to see the sample solution
10. Write a Python program to create bar plot of scores by group and gender. Use multiple X values on the same chart for men and women.
Sample Data:
Means (men) = (22, 30, 35, 35, 26)
Means (women) = (25, 32, 30, 35, 29)
The code snippet gives the output shown in the following screenshot:

Click me to see the sample solution
11. Write a Python program to create bar plot from a DataFrame.
Sample Data Frame:
a b c d e
2 4,8,5,7,6
4 2,3,4,2,6
6 4,7,4,7,8
8 2,6,4,8,6
10 2,4,3,3,2
The code snippet gives the output shown in the following screenshot:

Click me to see the sample solution
12. Write a Python program to create bar plots with error bars on the same figure.
Sample Date
Mean velocity: 0.2474, 0.1235, 0.1737, 0.1824
Standard deviation of velocity: 0.3314, 0.2278, 0.2836, 0.2645
The code snippet gives the output shown in the following screenshot:

Click me to see the sample solution
13. Write a Python program to create bar plots with errorbars on the same figure. Attach a text label above each bar displaying men means (integer value).
Sample Data
Mean velocity: 0.2474, 0.1235, 0.1737, 0.1824
Standard deviation of velocity: 0.3314, 0.2278, 0.2836, 0.2645
The code snippet gives the output shown in the following screenshot:

Click me to see the sample solution
14. Write a Python program to create a stacked bar plot with error bars.
Note: Use bottom to stack the women?s bars on top of the men?s bars.
Sample Data:
Means (men) = (22, 30, 35, 35, 26)
Means (women) = (25, 32, 30, 35, 29)
Men Standard deviation = (4, 3, 4, 1, 5)
Women Standard deviation = (3, 5, 2, 3, 3)
The code snippet gives the output shown in the following screenshot:

Click me to see the sample solution
15. Write a Python program to create a horizontal bar chart with differently ordered colors.
Note: Use bottom to stack the women?s bars on top of the men?s bars.
Sample Data Set:
languages = [['Language','Science','Math'],
['Science','Math','Language'],
['Math','Language','Science']]
numbers = [{'Language':75, 'Science':88, 'Math':96},
{'Language':71, 'Science':95, 'Math':92},
{'Language':75, 'Science':90, 'Math':89}]
The code snippet gives the output shown in the following screenshot:

Click me to see the sample solution
16. Write a Python program to create stack bar plot and add label to each section.
Sample data:
people = ('G1','G2','G3','G4','G5','G6','G7','G8')
segments = 4
# multi-dimensional data
data = [[ 3.40022085, 7.70632498, 6.4097905, 10.51648577, 7.5330039,
7.1123587, 12.77792868, 3.44773477],
[ 11.24811149, 5.03778215, 6.65808464, 12.32220677, 7.45964195,
6.79685302, 7.24578743, 3.69371847],
[ 3.94253354, 4.74763549, 11.73529246, 4.6465543, 12.9952182,
4.63832778, 11.16849999, 8.56883433],
[ 4.24409799, 12.71746612, 11.3772169, 9.00514257, 10.47084185,
10.97567589, 3.98287652, 8.80552122]]
The code snippet gives the output shown in the following screenshot:

Click me to see the sample solution
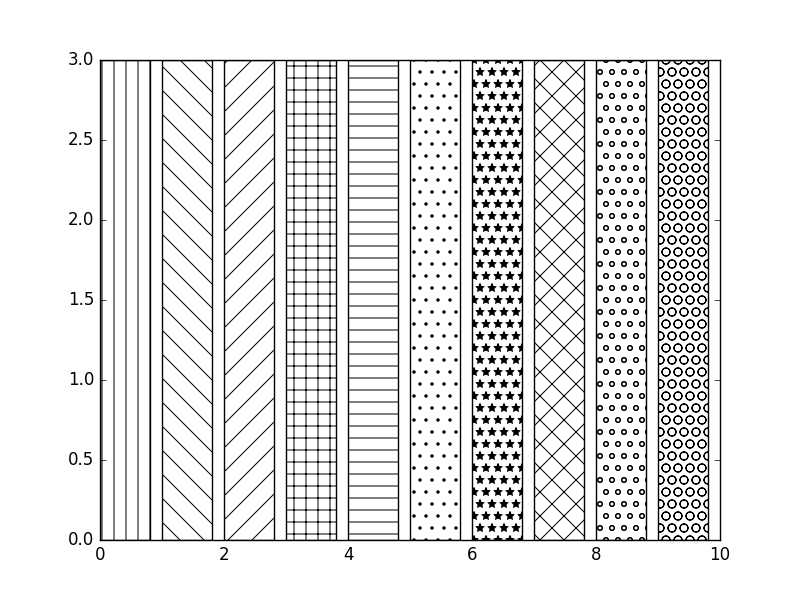
17. Write a Python program to add textures (black and white) to bars and wedges.
Note: Use bottom to stack the womens bars on top of the mens bars.
The code snippet gives the output shown in the following screenshot:
Click me to see the sample solution
Python Code Editor:
More to Come !
Do not submit any solution of the above exercises at here, if you want to contribute go to the appropriate exercise page.