Python Scikit-learn: Create a plot to get a general Statistics of Iris data
Python Machine learning Iris Visualization: Exercise-1 with Solution
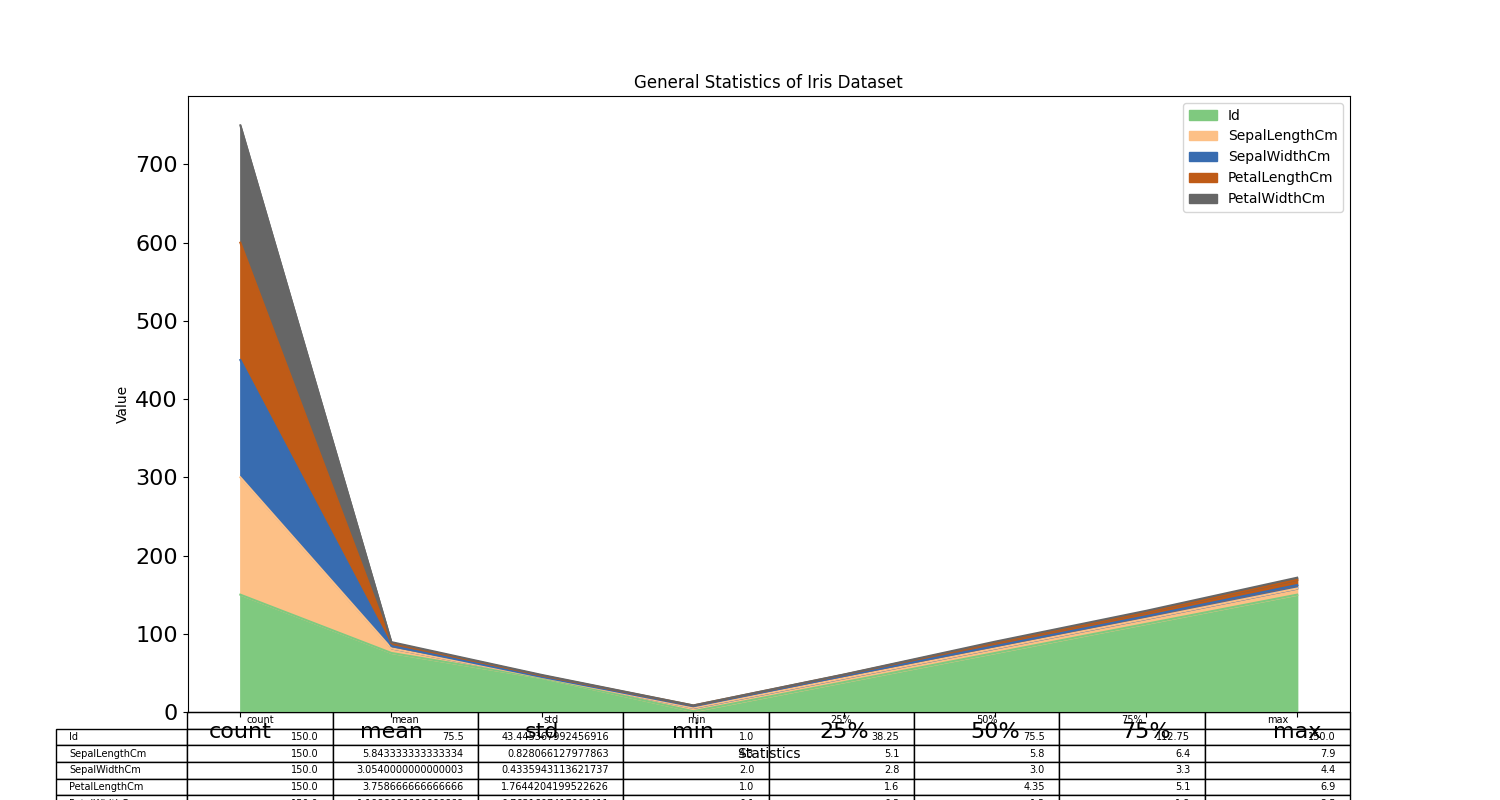
Write a Python program to create a plot to get a general Statistics of Iris data.
Sample Solution:
Python Code:
import pandas as pd
import matplotlib.pyplot as plt
iris = pd.read_csv("iris.csv")
iris.describe().plot(kind = "area",fontsize=16, figsize = (15,8), table = True, colormap="Accent")
plt.xlabel('Statistics',)
plt.ylabel('Value')
plt.title("General Statistics of Iris Dataset")
plt.show()
Sample Output:
Go to:
PREV : Python Machine learning Iris Basic Exercises Home.
NEXT : Write a Python program to create a Bar plot to get the frequency of the three species of the Iris data.
Python Code Editor:
Have another way to solve this solution? Contribute your code (and comments) through Disqus.
What is the difficulty level of this exercise?