Python Scikit-learn: Create a Bar plot to get the frequency of the three species of the Iris data
Python Machine learning Iris Visualization: Exercise-2 with Solution
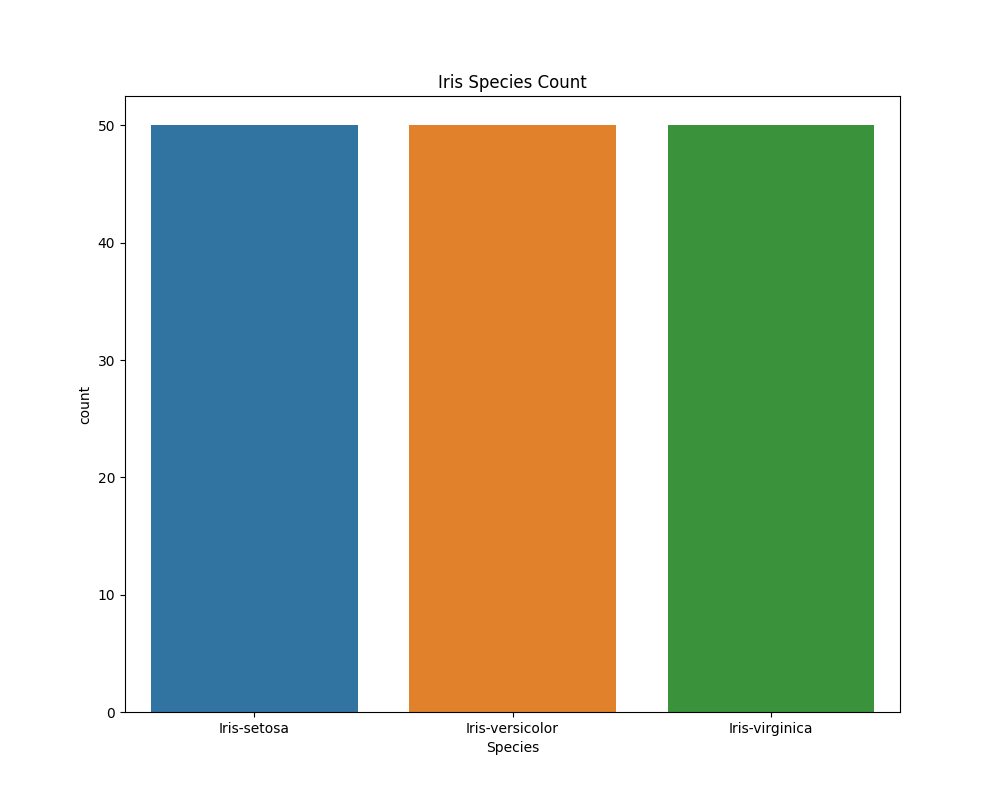
Write a Python program to create a Bar plot to get the frequency of the three species of the Iris data.
Sample Solution:
Python Code:
import pandas as pd
import seaborn as sns
import matplotlib.pyplot as plt
iris = pd.read_csv("iris.csv")
ax=plt.subplots(1,1,figsize=(10,8))
sns.countplot('Species',data=iris)
plt.title("Iris Species Count")
plt.show()
Sample Output:
Go to:
PREV : Write a Python program to create a plot to get a general Statistics of Iris data.
NEXT : Write a Python program to create a Pie plot to get the frequency of the three species of the Iris data.
Python Code Editor:
Have another way to solve this solution? Contribute your code (and comments) through Disqus.
What is the difficulty level of this exercise?