Python Scikit-learn: Create a joinplot to describe individual distributions on the same plot between Sepal length and Sepal width
Python Machine learning Iris Visualization: Exercise-8 with Solution
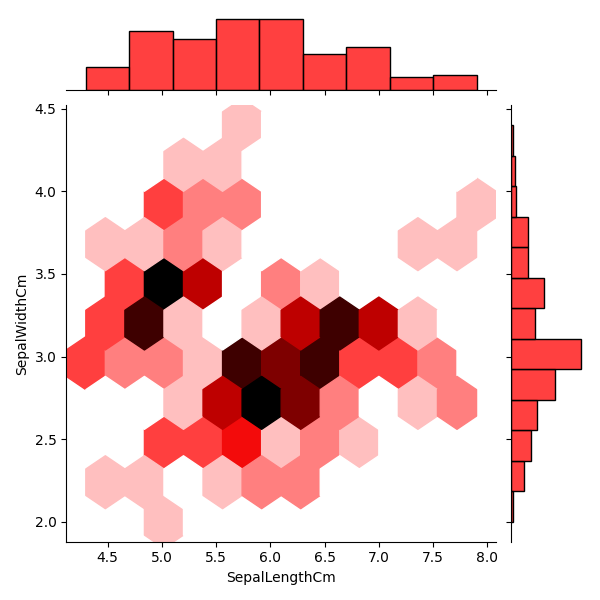
Write a Python program to create a joinplot to describe individual distributions on the same plot between Sepal length and Sepal width.
Note: The bivariate analogue of a histogram is known as a “hexbin” plot, because it shows the counts of observations that fall within hexagonal bins. This plot works best with relatively large datasets. It’s available through the matplotlib plt.hexbin function and as a style in jointplot(). It looks best with a white background.
Sample Solution:
Python Code:
import pandas as pd
import seaborn as sns
import matplotlib.pyplot as plt
iris = pd.read_csv("iris.csv")
fig=sns.jointplot(x='SepalLengthCm', y='SepalWidthCm', kind="hex", color="red", data=iris)
plt.show()
Sample Output:
Go to:
PREV : Write a Python program to create a joinplot to describe individual distributions on the same plot between Sepal length and Sepal width.
NEXT : Write a Python program to create a joinplot using “kde” to describe individual distributions on the same plot between Sepal length and Sepal width.
Python Code Editor:
Have another way to solve this solution? Contribute your code (and comments) through Disqus.
What is the difficulty level of this exercise?