Python Scikit-learn: Create a joinplot using “kde” to describe individual distributions on the same plot between Sepal length and Sepal width
Python Machine learning Iris Visualization: Exercise-9 with Solution
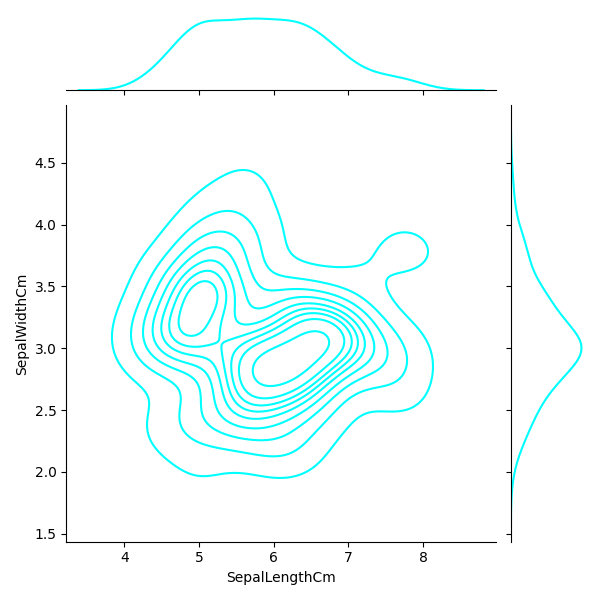
Write a Python program to create a joinplot using “kde” to describe individual distributions on the same plot between Sepal length and Sepal width.
Note: The kernel density estimation (kde) procedure visualize a bivariate distribution. In seaborn, this kind of plot is shown with a contour plot and is available as a style in jointplot().
Sample Solution:
Python Code:
import matplotlib.pyplot as plt
import pandas as pd
import seaborn as sns
iris = pd.read_csv("iris.csv")
fig=sns.jointplot(x='SepalLengthCm', y='SepalWidthCm', kind="kde", color='cyan', data=iris)
plt.show()
Sample Output:
Go to:
PREV : Write a Python program to create a joinplot to describe individual distributions on the same plot between Sepal length and Sepal width.
NEXT : Write a Python program to create a joinplot and add regression and kernel density fits using “reg” to describe individual distributions on the same plot between Sepal length and Sepal width.
Python Code Editor:
Have another way to solve this solution? Contribute your code (and comments) through Disqus.
What is the difficulty level of this exercise?