NumPy: Compute the histogram of nums against the bins
14. Compute Histogram of Data Against Bins
Write a NumPy program to compute the histogram of nums against the bins.
Sample Solution:
Python Code:
# Importing necessary libraries
import numpy as np
import matplotlib.pyplot as plt

# Creating an array of numbers
nums = np.array([0.5, 0.7, 1.0, 1.2, 1.3, 2.1])

# Defining the bins
bins = np.array([0, 1, 2, 3])

# Displaying the original arrays
print("nums: ", nums)
print("bins: ", bins)

# Calculating the histogram using numpy's histogram function
print("Result:", np.histogram(nums, bins))

# Creating a histogram plot using matplotlib
plt.hist(nums, bins=bins)

# Displaying the histogram
plt.show()
Sample Output:
nums:  [0.5 0.7 1.  1.2 1.3 2.1]
bins:  [0 1 2 3]
Result: (array([2, 3, 1], dtype=int64), array([0, 1, 2, 3]))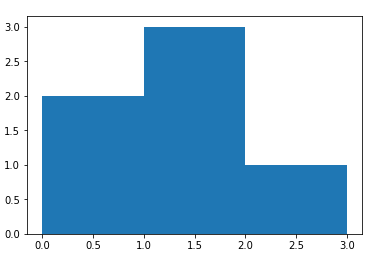
Explanation:
In the above exercise –
nums = np.array([0.5, 0.7, 1.0, 1.2, 1.3, 2.1]): This code creates a NumPy array containing the numbers to be plotted on the histogram.
bins = np.array([0, 1, 2, 3]): This code creates a NumPy array containing the bin edges for the histogram.
print("Result:", np.histogram(nums, bins)): This line calculates and prints the histogram of the given numbers using the specified bins. np.histogram returns two arrays: the histogram values and the bin edges.
plt.hist(nums, bins=bins): This line plots the histogram using Matplotlib's hist() function. The bins parameter specifies the bin edges to use.
plt.show(): This line displays the histogram plot.
For more Practice: Solve these Related Problems:
- Write a function that computes the histogram of a 1D array of floats using np.histogram with custom bin edges.
- Create a program that plots the histogram using matplotlib and verifies that the bin counts match np.histogram output.
- Implement a solution that normalizes the histogram counts to produce a probability density function.
- Develop a method that dynamically determines optimal bin sizes based on the data range and returns both counts and bin edges.
Go to:
PREV : Count Occurrences Using bincount
NEXT : NumPy Random Exercises Home.
Python-Numpy Code Editor:
Have another way to solve this solution? Contribute your code (and comments) through Disqus.What is the difficulty level of this exercise?
Test your Programming skills with w3resource's quiz.