Calculating correlation matrix for DataFrame in Python
Calculate the correlation matrix for a Pandas DataFrame.
Sample Solution:
Python Code:
import pandas as pd

# Create a sample DataFrame
data = {'Age': [25, 30, 22, 35, 28],
        'Salary': [50000, 60000, 45000, 70000, 55000],
        'Experience': [2, 5, 1, 8, 4]}

df = pd.DataFrame(data)

# Calculate the correlation matrix
correlation_matrix = df.corr()

# Display the correlation matrix
print(correlation_matrix)
Output:
                 Age    Salary  Experience
Age         1.000000  0.997791    0.995910
Salary      0.997791  1.000000    0.996616
Experience  0.995910  0.996616    1.000000
Explanation:
In the exerciser above
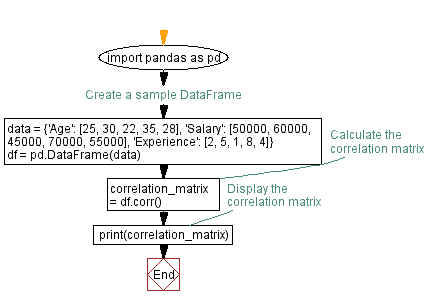
- First we create a sample DataFrame (df) with columns 'Age', 'Salary', and 'Experience'.
- The df.corr() method calculates the correlation matrix for the numeric columns in the DataFrame.
- The resulting correlation_matrix is then printed to the console.
The correlation matrix provides information about the pairwise correlations between the columns. Values range from -1 to 1, where 1 indicates a perfect positive correlation, -1 indicates a perfect negative correlation, and 0 indicates no correlation
Flowchart:

Python Code Editor:
Previous: Applying NumPy function to DataFrame column in Python.
Next: Calculating cumulative sum in Pandas DataFrame with NumPy array.
What is the difficulty level of this exercise?
Test your Programming skills with w3resource's quiz.
