Reshaping Pandas DataFrame with pivot_table in Python
Reshape a Pandas DataFrame using the pivot_table function.
Sample Solution:
Python Code:
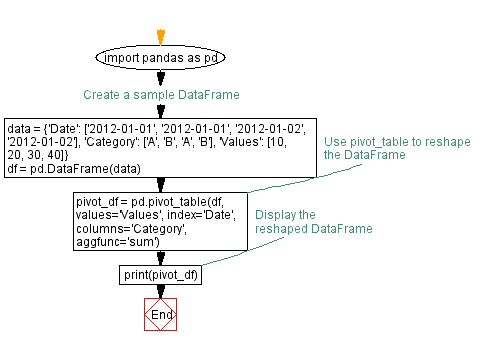
import pandas as pd

# Create a sample DataFrame
data = {'Date': ['2012-01-01', '2012-01-01', '2012-01-02', '2012-01-02'],
        'Category': ['A', 'B', 'A', 'B'],
        'Values': [10, 20, 30, 40]}

df = pd.DataFrame(data)

# Use pivot_table to reshape the DataFrame
pivot_df = pd.pivot_table(df, values='Values', index='Date', columns='Category', aggfunc='sum')

# Display the reshaped DataFrame
print(pivot_df)
Output:
Category     A   B
Date
2012-01-01  10  20
2012-01-02  30  40
Explanation:
In the exerciser above,
- We create a sample DataFrame (df) with columns 'Date', 'Category', and 'Values'.
- The pd.pivot_table function is used to reshape the DataFrame. We specify the values to aggregate ('Values'), the index ('Date'), the columns ('Category'), and the aggregation function ('sum').
- The result is a new DataFrame (pivot_df) with 'Date' as the index, 'Category' as columns, and the sum of 'Values' for each combination of date and category.
Flowchart:
Python Code Editor:
Previous: Grouping DataFrame by column and calculating mean in Python.
Next: Replacing missing values with column mean in Pandas DataFrame.
What is the difficulty level of this exercise?
Test your Programming skills with w3resource's quiz.