Replacing missing values with column mean in Pandas DataFrame
Replace missing values in a Pandas DataFrame with the mean of the column.
Sample Solution:
Python Code:
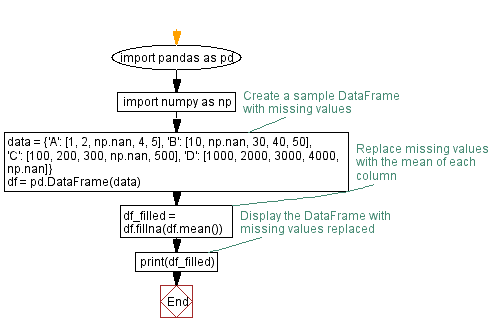
import pandas as pd
import numpy as np

# Create a sample DataFrame with missing values
data = {'A': [1, 2, np.nan, 4, 5],
        'B': [10, np.nan, 30, 40, 50],
        'C': [100, 200, 300, np.nan, 500],
        'D': [1000, 2000, 3000, 4000, np.nan]}

df = pd.DataFrame(data)

# Replace missing values with the mean of each column
df_filled = df.fillna(df.mean())

# Display the DataFrame with missing values replaced
print(df_filled)
Output:
     A     B      C       D
0  1.0  10.0  100.0  1000.0
1  2.0  32.5  200.0  2000.0
2  3.0  30.0  300.0  3000.0
3  4.0  40.0  275.0  4000.0
4  5.0  50.0  500.0  2500.0
Explanation:
In the exerciser above,
- Create a sample DataFrame (df) with some missing values (represented by np.nan).
- The df.mean() calculates the mean of each column.
- The df.fillna(df.mean()) replaces the missing values in each column with the mean of that column.
- The result is a new DataFrame (df_filled) with missing values replaced by the mean of each column.
Flowchart:
Python Code Editor:
Previous: Reshaping Pandas DataFrame with pivot_table in Python.
Next: Creating Histogram with NumPy and Matplotlib in Python.
What is the difficulty level of this exercise?
Test your Programming skills with w3resource's quiz.