Creating Histogram with NumPy and Matplotlib in Python
Create a histogram of a numerical column using NumPy and Matplotlib.
Sample Solution:
Python Code:
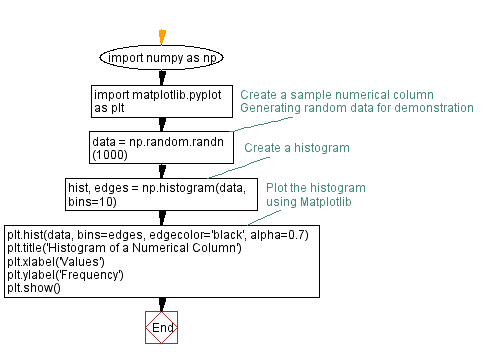
import numpy as np
import matplotlib.pyplot as plt

# Create a sample numerical column
data = np.random.randn(1000)  # Generating random data for demonstration

# Create a histogram
hist, edges = np.histogram(data, bins=10)

# Plot the histogram using Matplotlib
plt.hist(data, bins=edges, edgecolor='black', alpha=0.7)
plt.title('Histogram of a Numerical Column')
plt.xlabel('Values')
plt.ylabel('Frequency')
plt.show()
Output:

Explanation:
In the exerciser above,
- First we create a sample numerical column (data) with random data using numpy.random.randn(1000).
- The numpy.histogram function is used to calculate the histogram. It returns two arrays: hist (the values of the histogram bins) and edges (the edges of the bins).
- We use Matplotlib (plt.hist()) to plot the histogram, specifying the data, bins, edge color, and other parameters.
- Finally, we add labels and a title to the plot and display it using plt.show().
Flowchart:
Python Code Editor:
Previous: Replacing missing values with column mean in Pandas DataFrame.
Next: Normalizing numerical column in Pandas DataFrame with Min-Max scaling.
What is the difficulty level of this exercise?
Test your Programming skills with w3resource's quiz.