Create a Mandelbrot Fractal image with Python and Tkinter
Write a Python program that generates a fractal image (e.g., the Mandelbrot set) and displays it on the Canvas widget using Tkinter.
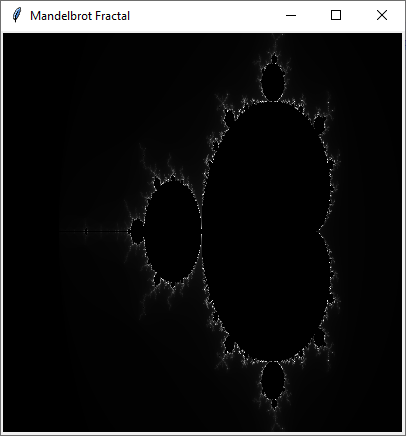
The Mandelbrot set is a two-dimensional set with a relatively simple definition that exhibits great complexity, especially as it is magnified. It is popular for its aesthetic appeal and fractal structures.
Sample Solution:
Python Code:
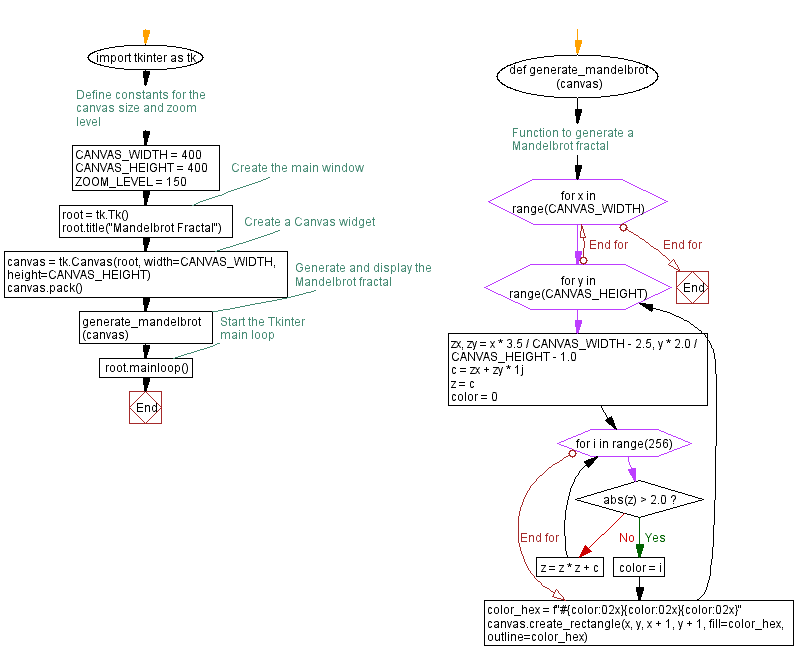
import tkinter as tk

# Define constants for the canvas size and zoom level
CANVAS_WIDTH = 400
CANVAS_HEIGHT = 400
ZOOM_LEVEL = 150

# Function to generate a Mandelbrot fractal
def generate_mandelbrot(canvas):
    for x in range(CANVAS_WIDTH):
        for y in range(CANVAS_HEIGHT):
            zx, zy = x * 3.5 / CANVAS_WIDTH - 2.5, y * 2.0 / CANVAS_HEIGHT - 1.0
            c = zx + zy * 1j
            z = c
            color = 0
            for i in range(256):
                if abs(z) > 2.0:
                    color = i
                    break
                z = z * z + c
            color_hex = f"#{color:02x}{color:02x}{color:02x}"
            canvas.create_rectangle(x, y, x + 1, y + 1, fill=color_hex, outline=color_hex)

# Create the main window
root = tk.Tk()
root.title("Mandelbrot Fractal")

# Create a Canvas widget
canvas = tk.Canvas(root, width=CANVAS_WIDTH, height=CANVAS_HEIGHT)
canvas.pack()

# Generate and display the Mandelbrot fractal
generate_mandelbrot(canvas)

# Start the Tkinter main loop
root.mainloop()
Explanation:
In the exercise above -
- Import the Tkinter library (tkinter).
- Define the constants:
- CANVAS_WIDTH and CANVAS_HEIGHT: Define the dimensions (in pixels) of the canvas where the Mandelbrot fractal will be displayed.
- ZOOM_LEVEL: This constant determines the zoom level for the fractal.
- Define the generate_mandelbrot function:
- Generates the Mandelbrot fractal and draws it on a given canvas.
- It iterates through each pixel (x, y) in the canvas, where x and y are within the canvas dimensions.
- For each pixel, it converts position (x, y) to complex numbers (zx, zy) within a specific range.
- It initializes a complex number c with the converted values (zx, zy).
- It iteratively calculates the Mandelbrot set using the formula z = z * z + c and checks if the absolute value of z becomes greater than 2.0. If it does, it breaks the loop and assigns the current iteration count as the color.
- The color is converted into a hexadecimal color code.
- A rectangle of size 1x1 pixel with the calculated color is drawn on the canvas at position (x, y).
- Create the main window:
- The main window for the application is created using tk.Tk().
- The window title is set to "Mandelbrot Fractal."
- Create a Canvas widget:
- A canvas widget is created with the specified CANVAS_WIDTH and CANVAS_HEIGHT dimensions.
- The canvas is displayed within the main window using canvas.pack().
- Generate and Display the Mandelbrot Fractal:
- The generate_mandelbrot function generates the fractal and draws it on the canvas.
- Start the Tkinter main loop.
Output:
Flowchart:
Go to:
Previous: Create a 'Catch the Ball' game with Python and Tkinter.
Next: Build interactive charts and graphs with Python and Tkinter.
Python Code Editor:
What is the difficulty level of this exercise?
Test your Programming skills with w3resource's quiz.