Draw an empty Plot and Set Axes Limits in R
Write a R program to draw an empty plot and an empty plot specify the axes limits of the graphic.
Sample Solution :
R Programming Code :
# Uncomment to print a message indicating an empty plot
#print("Empty plot:")

# Create a new empty plot with no axes or labels
plot.new()

# Uncomment to print a message indicating an empty plot with specified axes limits
#print("Empty plot specify the axes limits of the graphic:")

# Create an empty plot with specified x and y limits, without plotting points
plot(1, type="n", xlab="", ylab="", xlim=c(0, 20), ylim=c(0, 20))
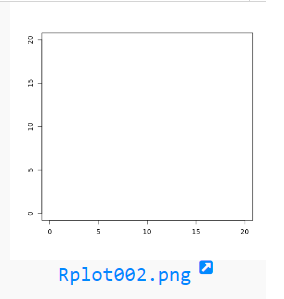
Output:
Explanation:
- #print("Empty plot:")
- This line is a comment that indicates the intention to create an empty plot.
- plot.new()
- Creates a new, empty plotting window in R. This initializes the plotting area but does not add any data or features.
- #print("Empty plot specify the axes limits of the graphic:")
- This line is a comment that indicates the intention to create an empty plot with specified axes limits.
- plot(1, type="n", xlab="", ylab="", xlim=c(0, 20), ylim=c(0, 20))
- Plots a blank graph with:
- type="n": Specifies no plotting of points or lines, creating an empty plot.
- xlab="" and ylab="": No labels for x-axis and y-axis.
- xlim=c(0, 20) and ylim=c(0, 20): Sets the limits of the x-axis and y-axis to range from 0 to 20.
Go to:
PREV : Write a R program to create a list of elements using vectors, matrices and a functions. Print the content of the list.
NEXT : Write a R program to create a simple bar plot of five subjects marks.
R Programming Code Editor:
Have another way to solve this solution? Contribute your code (and comments) through Disqus.
Test your Programming skills with w3resource's quiz.
What is the difficulty level of this exercise?