Create a Simple Bar Plot of five Subjects' marks in R
Write a R program to create a simple bar plot of five subjects marks.
Sample Solution :
R Programming Code :
# Define a vector of marks for the 4 subjects
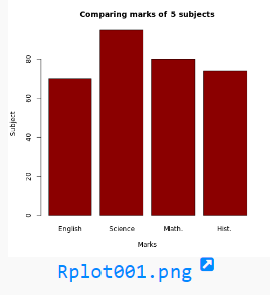
marks = c(70, 95, 80, 74)
# Create a bar plot with the specified marks
barplot(marks,
# Set the title of the bar plot
main = "Comparing marks of 5 subjects",
# Label the x-axis as "Marks"
xlab = "Marks",
# Label the y-axis as "Subject"
ylab = "Subject",
# Set the names of the bars
names.arg = c("English", "Science", "Math.", "Hist."),
# Set the color of the bars to dark red
col = "darkred",
# Ensure the bars are vertical
horiz = FALSE)
Output:
Explanation:
- marks = c(70, 95, 80, 74)
- Creates a vector marks containing the values 70, 95, 80, and 74, which represent the marks for four subjects.
- barplot(marks,
- Calls the barplot function to create a bar plot of the marks vector.
- main = "Comparing marks of 5 subjects",
- Sets the title of the bar plot to "Comparing marks of 5 subjects."
- xlab = "Marks",
- Labels the x-axis as "Marks."
- ylab = "Subject",
- Labels the y-axis as "Subject."
- names.arg = c("English", "Science", "Math.", "Hist."),
- Provides names for each bar in the plot, corresponding to the subjects: English, Science, Math, and History.
- col = "darkred",
- Sets the color of the bars to dark red.
- horiz = FALSE
- Specifies that the bars should be vertical (not horizontal).
Go to:
PREV : Write a R program to draw an empty plot and an empty plot specify the axes limits of the graphic.
NEXT : Write a R program to create bell curve of a random normal distribution.
R Programming Code Editor:
Have another way to solve this solution? Contribute your code (and comments) through Disqus.
Test your Programming skills with w3resource's quiz.
What is the difficulty level of this exercise?