R Programming: Create a Bell curve of a Random Normal Distribution
Write a R program to create bell curve of a random normal distribution.
Sample Solution :
R Programming Code :
# Generate a vector of 10,000 random numbers from a normal distribution
# with a mean of 500 and a standard deviation of 100, then round down
n = floor(rnorm(10000, 500, 100))

# Create a frequency table of the generated numbers
t = table(n)

# Create a bar plot of the frequency table
barplot(t)
Output:
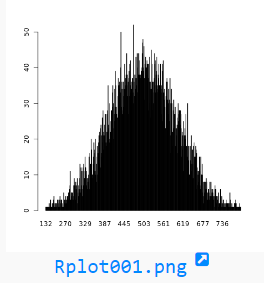
Explanation:
- Generate Random Data:
- n = floor(rnorm(10000, 500, 100)): Generates 10,000 random numbers from a normal distribution with a mean of 500 and a standard deviation of 100. The floor() function rounds these numbers down to the nearest integer.
- Create a Frequency Table:
- t = table(n): Creates a frequency table that counts how many times each unique value appears in the vector n.
- Create a Bar Plot:
- barplot(t): Generates a bar plot to visualize the frequency distribution of the values from the frequency table t
Go to:
PREV : Write a R program to create a simple bar plot of five subjects marks.
NEXT : Write a R program to compute sum, mean and product of a given vector elements.
R Programming Code Editor:
Have another way to solve this solution? Contribute your code (and comments) through Disqus.
Test your Programming skills with w3resource's quiz.
What is the difficulty level of this exercise?