Pandas: Heatmap of NaNs in a given DataFrame
20. Create a Heatmap of Missing Value Distribution
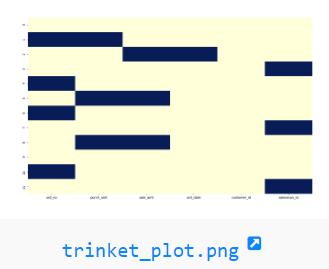
Write a Pandas program to create a hitmap for more information about the distribution of missing values in a given DataFrame.
Test Data:
     ord_no  purch_amt  sale_amt    ord_date  customer_id  salesman_id
0   70001.0     150.50     10.50  2012-10-05         3002       5002.0
1       NaN        NaN     20.65  2012-09-10         3001       5003.0
2   70002.0      65.26       NaN         NaN         3001       5001.0
3   70004.0     110.50     11.50  2012-08-17         3003          NaN
4       NaN     948.50     98.50  2012-09-10         3002       5002.0
5   70005.0        NaN       NaN  2012-07-27         3001       5001.0
6       NaN    5760.00     57.00  2012-09-10         3001       5001.0
7   70010.0    1983.43     19.43  2012-10-10         3004          NaN
8   70003.0        NaN       NaN  2012-10-10         3003       5003.0
9   70012.0     250.45     25.45  2012-06-27         3002       5002.0
10      NaN      75.29     75.29  2012-08-17         3001       5003.0
11  70013.0    3045.60     35.60  2012-04-25         3001          NaN
Sample Solution:
Python Code :
import pandas as pd
import numpy as np
import seaborn as sns
import matplotlib.pyplot as plt
pd.set_option('display.max_rows', None)
#pd.set_option('display.max_columns', None)
df = pd.DataFrame({
'ord_no':[70001,np.nan,70002,70004,np.nan,70005,np.nan,70010,70003,70012,np.nan,70013],
'purch_amt':[150.5,np.nan,65.26,110.5,948.5,np.nan,5760,1983.43,np.nan,250.45, 75.29,3045.6],
'sale_amt':[10.5,20.65,np.nan,11.5,98.5,np.nan,57,19.43,np.nan,25.45, 75.29,35.6],
'ord_date': ['2012-10-05','2012-09-10',np.nan,'2012-08-17','2012-09-10','2012-07-27','2012-09-10','2012-10-10','2012-10-10','2012-06-27','2012-08-17','2012-04-25'],
'customer_id':[3002,3001,3001,3003,3002,3001,3001,3004,3003,3002,3001,3001],
'salesman_id':[5002,5003,5001,np.nan,5002,5001,5001,np.nan,5003,5002,5003,np.nan]})
plt.figure(figsize=(16,10))
sns.heatmap(df.isnull(), cbar=False, cmap="YlGnBu")
plt.show()
Sample Output:
For more Practice: Solve these Related Problems:
- Write a Pandas program to visualize the distribution of missing values in a DataFrame using a heatmap.
- Write a Pandas program to generate a color-coded heatmap that highlights NaN locations within the DataFrame.
- Write a Pandas program to use seaborn or matplotlib to plot a heatmap representing the pattern of missing data.
- Write a Pandas program to create a graphical representation of missing values in a DataFrame to analyze their distribution.
Go to:
PREV : Replace Missing Values with Most Frequent Value.
NEXT :
Pandas Data Cleaning and Preprocessing Exercises Home.
Python Code Editor:
Have another way to solve this solution? Contribute your code (and comments) through Disqus.
What is the difficulty level of this exercise?
Test your Programming skills with w3resource's quiz.