Pandas Series: plot.box() function
Series-plot.box() function
The plot.box() function is used to create a box plot of the DataFrame columns.
A box plot is a method for graphically depicting groups of numerical data through their quartiles.
Syntax:
Series.plot.box(self, by=None, **kwargs)
Parameters:
| Name | Description | Type/Default Value | Required / Optional |
|---|---|---|---|
| by | Column in the DataFrame to group by. | string or sequence | Required |
| y | Columns to be plotted from the DataFrame. | label or position, default All numeric columns in dataframe | Required |
| **kwds | Additional keywords are documented in DataFrame.plot(). | Optional |
Returns: matplotlib.axes.Axes or numpy.ndarray of them.
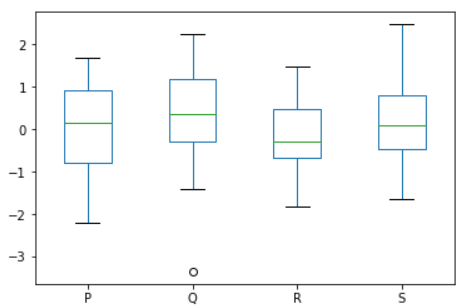
Example - Draw a box plot from a DataFrame with four columns of randomly generated data:
Python-Pandas Code:
import numpy as np
import pandas as pd
data = np.random.randn(22, 4)
df = pd.DataFrame(data, columns=list('PQRS'))
ax = df.plot.box()
Output:
PREV : Series-plot.barh() function
NEXT : Series-plot.density() function