Pandas Series: plot.pie() function
Series-plot.pie() function
A pie plot is a proportional representation of the numerical data in a column. This function wraps matplotlib.pyplot.pie() for the specified column. If no column reference is passed and subplots=True a pie plot is drawn for each numerical column independently.
The plot.pie() function is used to generate a pie plot.
Syntax:
Series.plot.pie(self, **kwargs)
Parameters:
| Name | Description | Type/Default Value | Required / Optional |
|---|---|---|---|
| y | Label or position of the column to plot. If not provided, subplots=True argument must be passed. | int or label | Optional |
| **kwds | Keyword arguments to pass on to DataFrame.plot(). |
Returns: matplotlib.axes.Axes or np.ndarray of them
A NumPy array is returned when subplots is True.
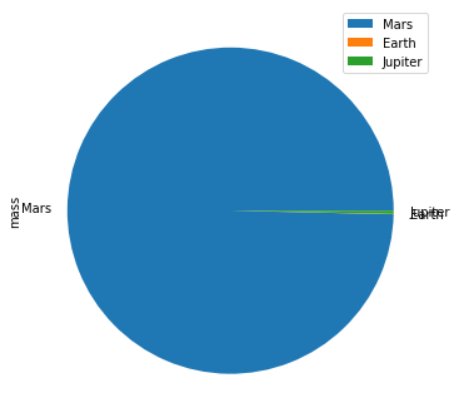
Example - In the example below we have a DataFrame with the information about planet’s mass and radius. We pass the the ‘mass’ column to the pie function to get a pie plot:
Python-Pandas Code:
import numpy as np
import pandas as pd
df = pd.DataFrame({'mass': [1898, 0.642 , 5.97],
                   'radius': [6051.8, 6378.1, 71492]},
                  index=['Mars', 'Earth', 'Jupiter'])
plot = df.plot.pie(y='mass', figsize=(6, 6))
Output:
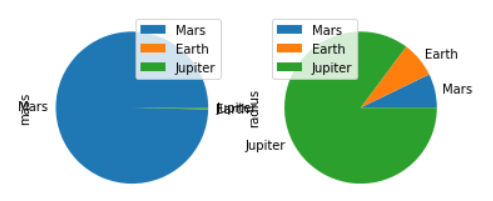
Python-Pandas Code:
import numpy as np
import pandas as pd
df = pd.DataFrame({'mass': [1898, 0.642 , 5.97],
                   'radius': [6051.8, 6378.1, 71492]},
                  index=['Mars', 'Earth', 'Jupiter'])
plot = df.plot.pie(subplots=True, figsize=(6, 4))
Output:
PREV : Series-plot.line() function
NEXT :
Series-to_pickle() function