Pandas Series: plot.line() function
Series-plot.line() function
The plot.line() function is used to plot Series or DataFrame as lines.
This function is useful to plot lines using DataFrame’s values as coordinates.
Syntax:
Series.plot.line(self, x=None, y=None, **kwargs)
Parameters:
| Name | Description | Type/Default Value | Required / Optional |
|---|---|---|---|
| x | Columns to use for the horizontal axis. Either the location or the label of the columns to be used. By default, it will use the DataFrame indices. | int or str | Optional |
| y | The values to be plotted. Either the location or the label of the columns to be used. By default, it will use the remaining DataFrame numeric columns. | int, str, or list of them | Optional |
| **kwds | Keyword arguments to pass on to DataFrame.plot(). |
Returns: matplotlib.axes.Axes or numpy.ndarray
Return an ndarray when subplots=True.
Example:
Python-Pandas Code:
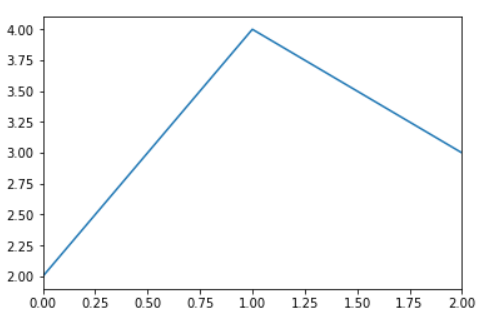
import numpy as np
import pandas as pd
s = pd.Series([2, 4, 3])
s.plot.line()
Output:
<matplotlib.axes._subplots.AxesSubplot at 0x9660710>
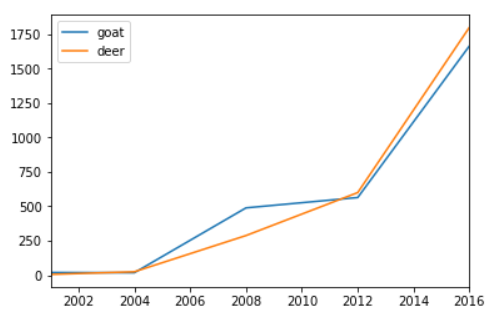
Example - The following example shows the populations for some animals over the years:
Python-Pandas Code:
import numpy as np
import pandas as pd
df = pd.DataFrame({
    'goat': [20, 18, 489, 564, 1665],
    'deer': [6, 25, 288, 600, 1800]
}, index=[2001, 2004, 2008, 2012, 2016])
lines = df.plot.line()
Output:
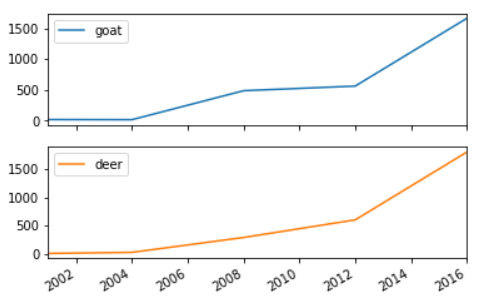
Example - An example with subplots, so an array of axes is returned:
Python-Pandas Code:
import numpy as np
import pandas as pd
df = pd.DataFrame({
    'goat': [20, 18, 489, 564, 1665],
    'deer': [6, 25, 288, 600, 1800]
}, index=[2001, 2004, 2008, 2012, 2016])
axes = df.plot.line(subplots=True)
type(axes)
Output:
numpy.ndarray
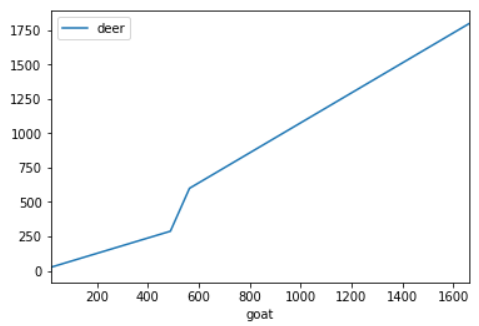
Example - The following example shows the relationship between both populations:
Python-Pandas Code:
import numpy as np
import pandas as pd
df = pd.DataFrame({
    'goat': [20, 18, 489, 564, 1665],
    'deer': [6, 25, 288, 600, 1800]
}, index=[2001, 2004, 2008, 2012, 2016])
axes = df.plot.line(subplots=True)
lines = df.plot.line(x='goat', y='deer')
Output:
numpy.ndarray
PREV : Series-plot.kde() function
NEXT :
Series-plot.pie() function