Debug JavaScript with Firebug
Firebug is a very powerful tool when it comes to finding and solving errors in code.
Here are the ways you can deal with errors of JavaScript code within a page. For this, first you need to load the page and open Firebug. Sometimes you need to reload the page.
Indicates number of an errors in the Status Bar
Shows error related to the currently open page only
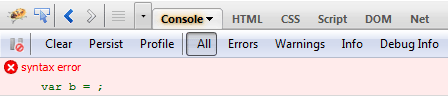
Shows detail information about the error
Execute code one step at a time
You can run the code step by step. This is very useful for debugging.
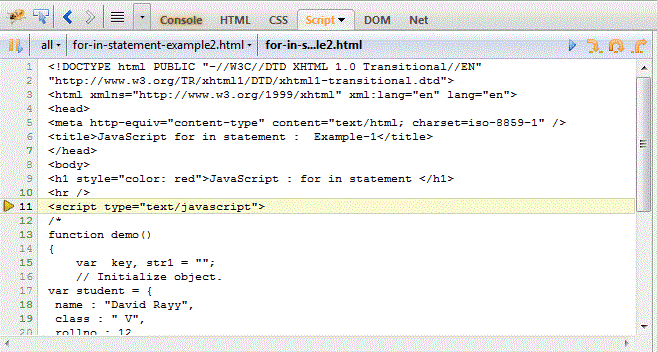
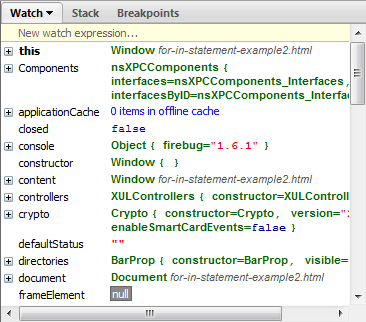
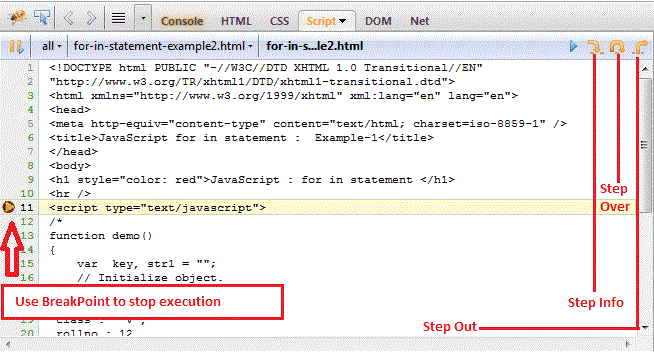
Using Break Point, Step Over
Break Points can be used to stop the execution of the code. This gives you a scope to check whether the program has got any error till the BreakPoint, which is very useful for debugging.
If you click Step over button, Firebug updates all the variables until your breakpoint and listing them on the right side of the debug window.
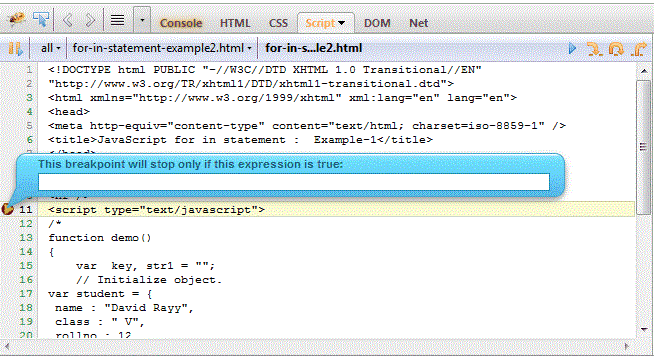
Use an expression against which the Break Point will be working
You can write an expression, so that if only if that condition is true, BreakPoint is going to stop the execution of the code.
Search
You can use a quick search to find a term within the code.

Previous: Inspect and edit HTML and CSS with Firebug
Next:
Profile JavaScript performance with Firebug
Test your Programming skills with w3resource's quiz.