Profile JavaScript performance with Firebug
Using Firebug, you can test which file of your web page is causing the delayed loading of the page.
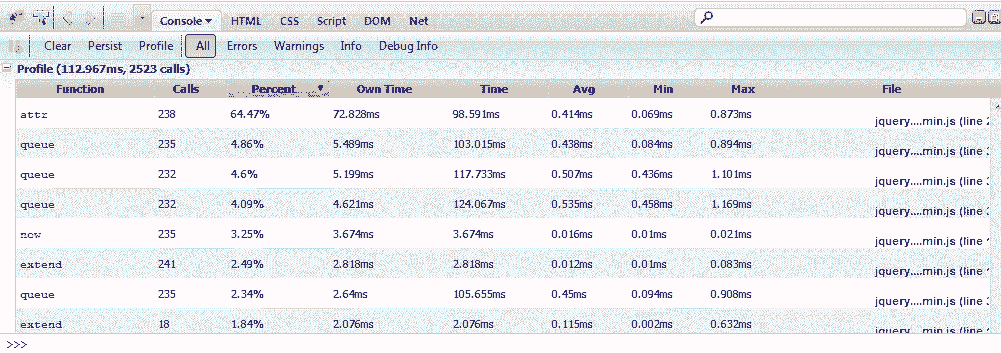
We have to open Firebug > Console and then click Profile. You need to reload the page you are testing. Then click Profile again and you will find a report in the console.

Previous: Debug JavaScript with Firebug
Next:
Execute JavaScript on the fly with Firebug
Test your Programming skills with w3resource's quiz.
- Weekly Trends
- Python Interview Questions and Answers: Comprehensive Guide
- Scala Exercises, Practice, Solution
- Kotlin Exercises practice with solution
- MongoDB Exercises, Practice, Solution
- SQL Exercises, Practice, Solution - JOINS
- Java Basic Programming Exercises
- SQL Subqueries
- Adventureworks Database Exercises
- C# Sharp Basic Exercises
- SQL COUNT() with distinct
- JavaScript String Exercises
- JavaScript HTML Form Validation
- Java Collection Exercises
- SQL COUNT() function
- SQL Inner Join