Cypress Dashboard Analytics: Metrics and Insights
In this tutorial we will walk you through the process of obtaining analytics from your dashboard.
The Cypress Dashboard provides Analytics that offers insight into your project’s metrics such as runs over time, run duration and visibility into the test’s suite size over time.
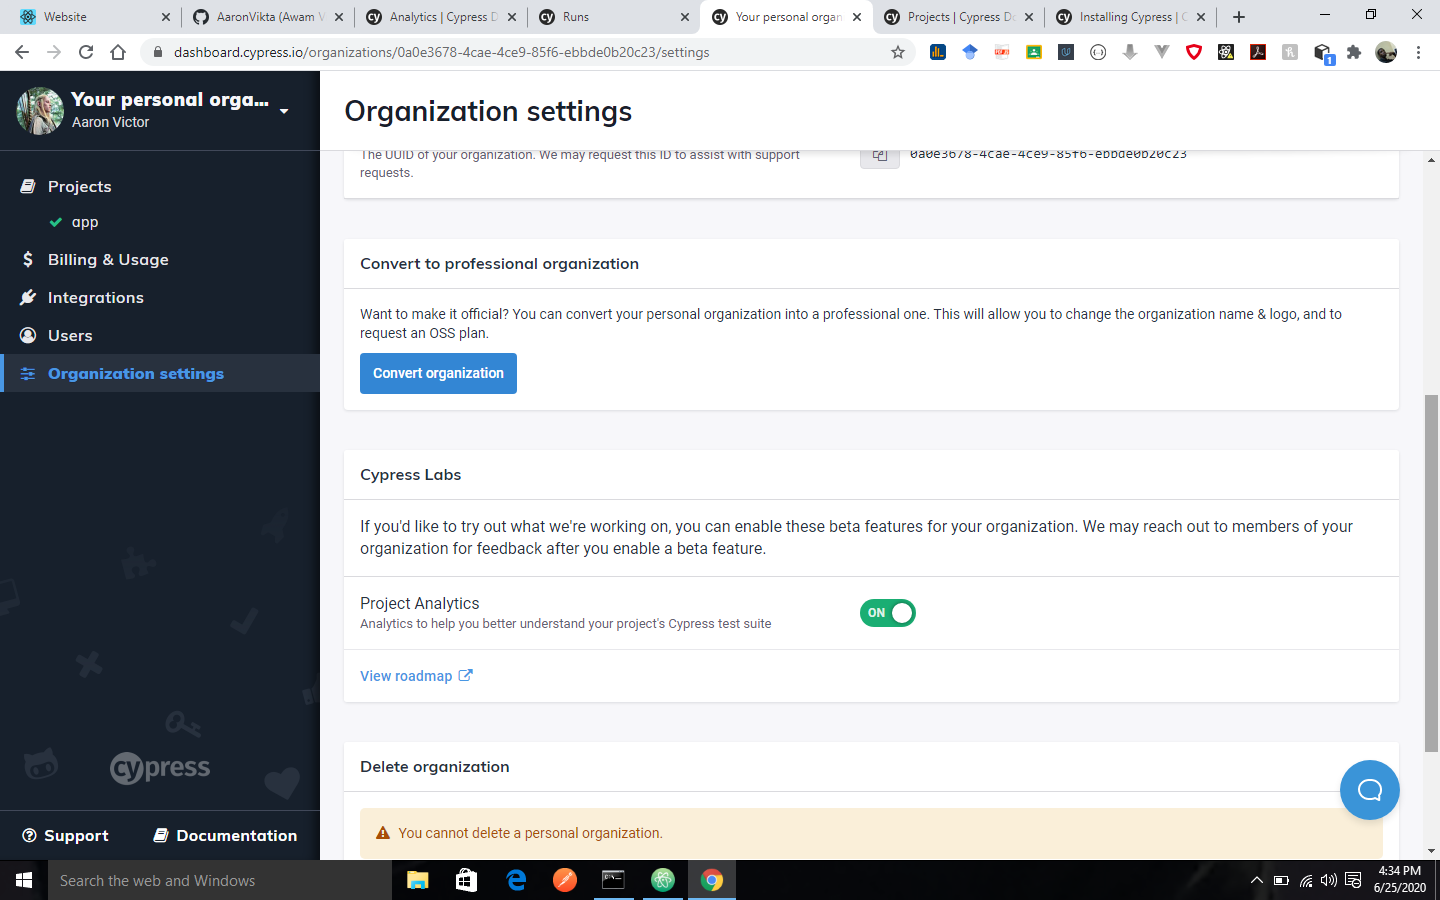
If you want to enable Dashboard Analytics, you will need to visit the Organization settings and then enable the “Project Analytics” setting under Cypress Labs.
Usage
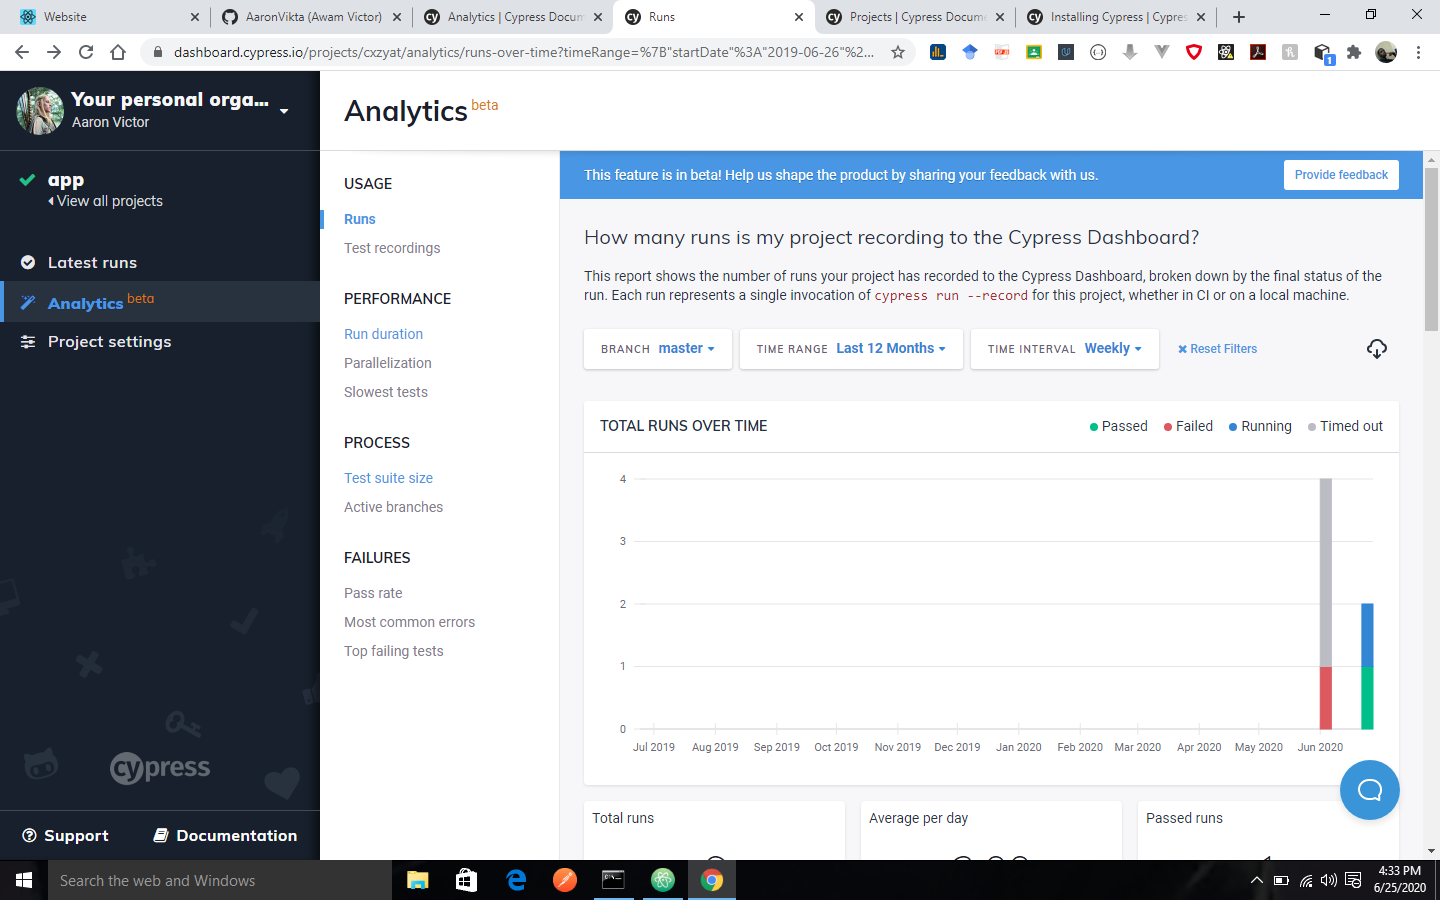
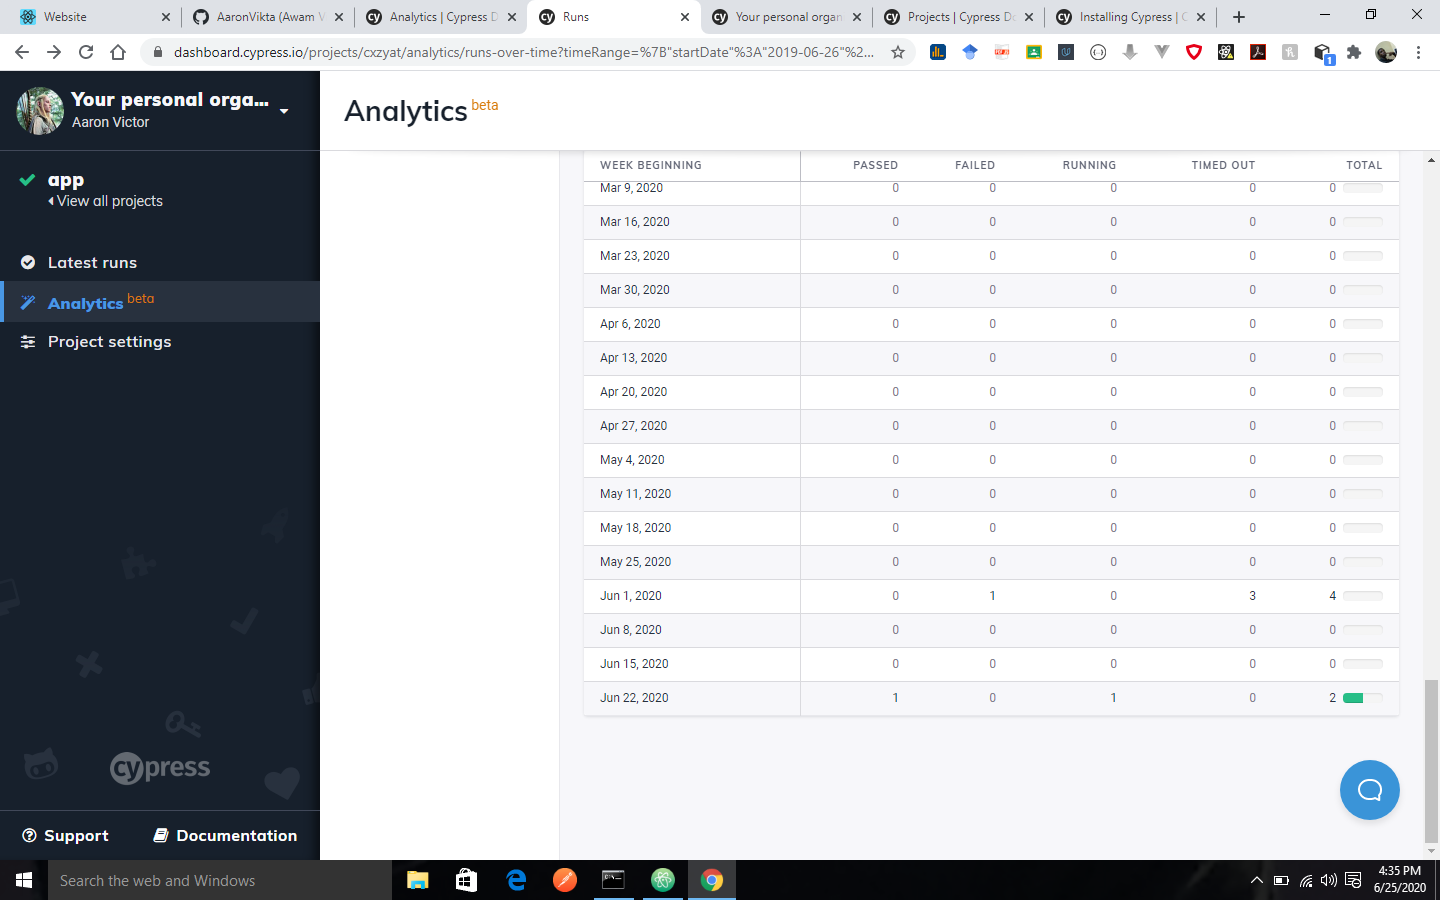
Runs over time

The runs over time report shows the number of runs that your organization has recorded to the Cypress Dashboard, this is broken down by the final status of the run. Each run represents a single invocation of cypress run –record for the project, whether it is done in CI or on a local machine.
Filters

The results can be filtered by:
- Branch
- Time Range
- The Time Interval
The total runs over time will be displayed for passed, failed, running, timed out and errored tests, this will be the display, irrespective of the filter that you select.
The result can be downloaded as a comma-separated values (CSV) file for further analysis.
You can download the result using the download icon to the right of the filters.
Key Performance Indicators
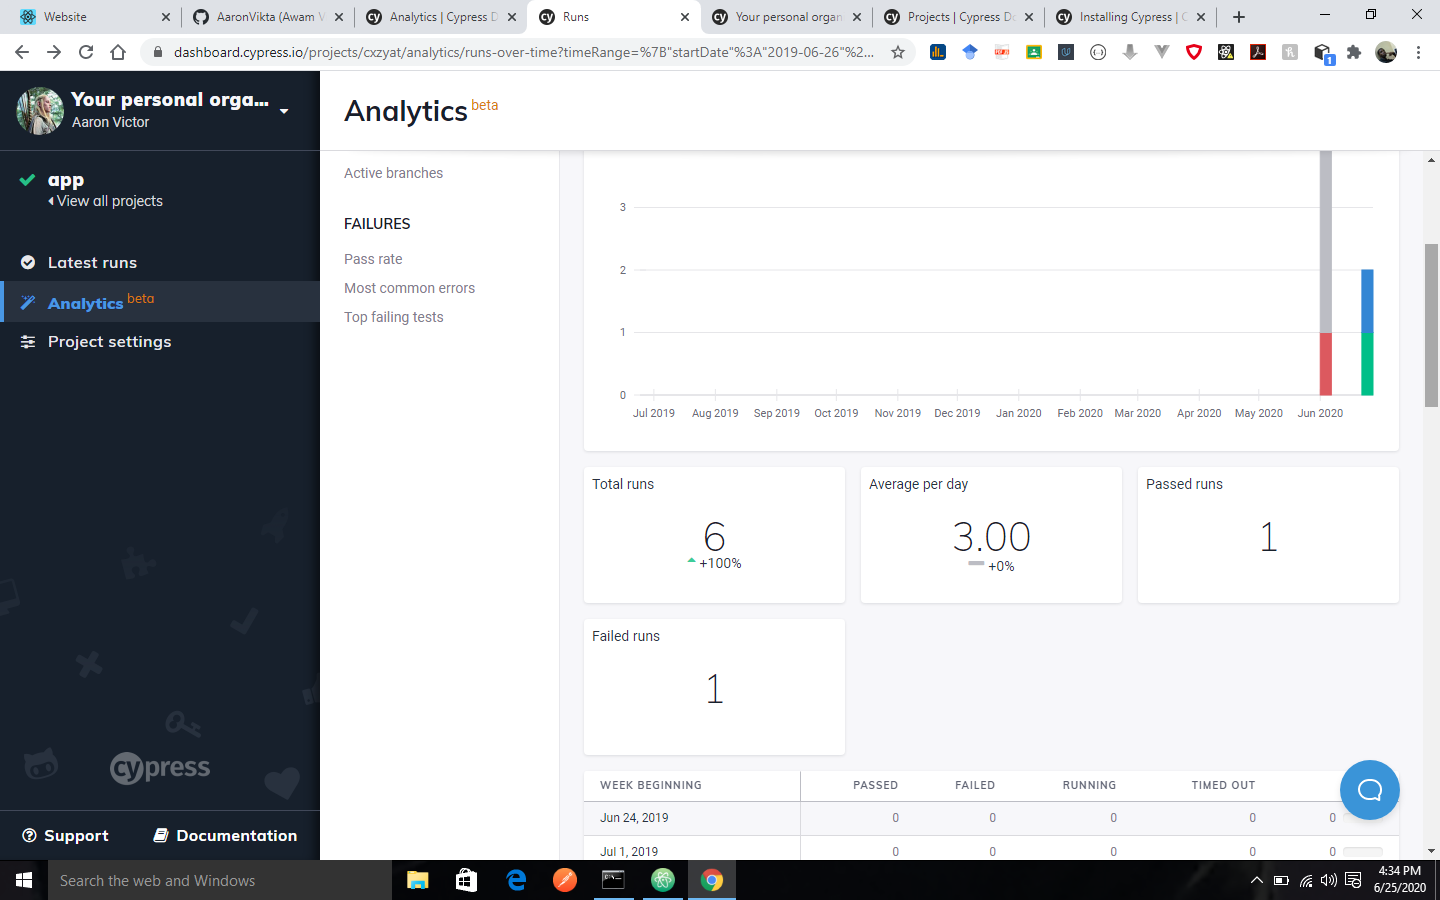
The total runs, average per day, passed runs and failed runs will be computed irrespective of the filter you select.
Performance
Run duration
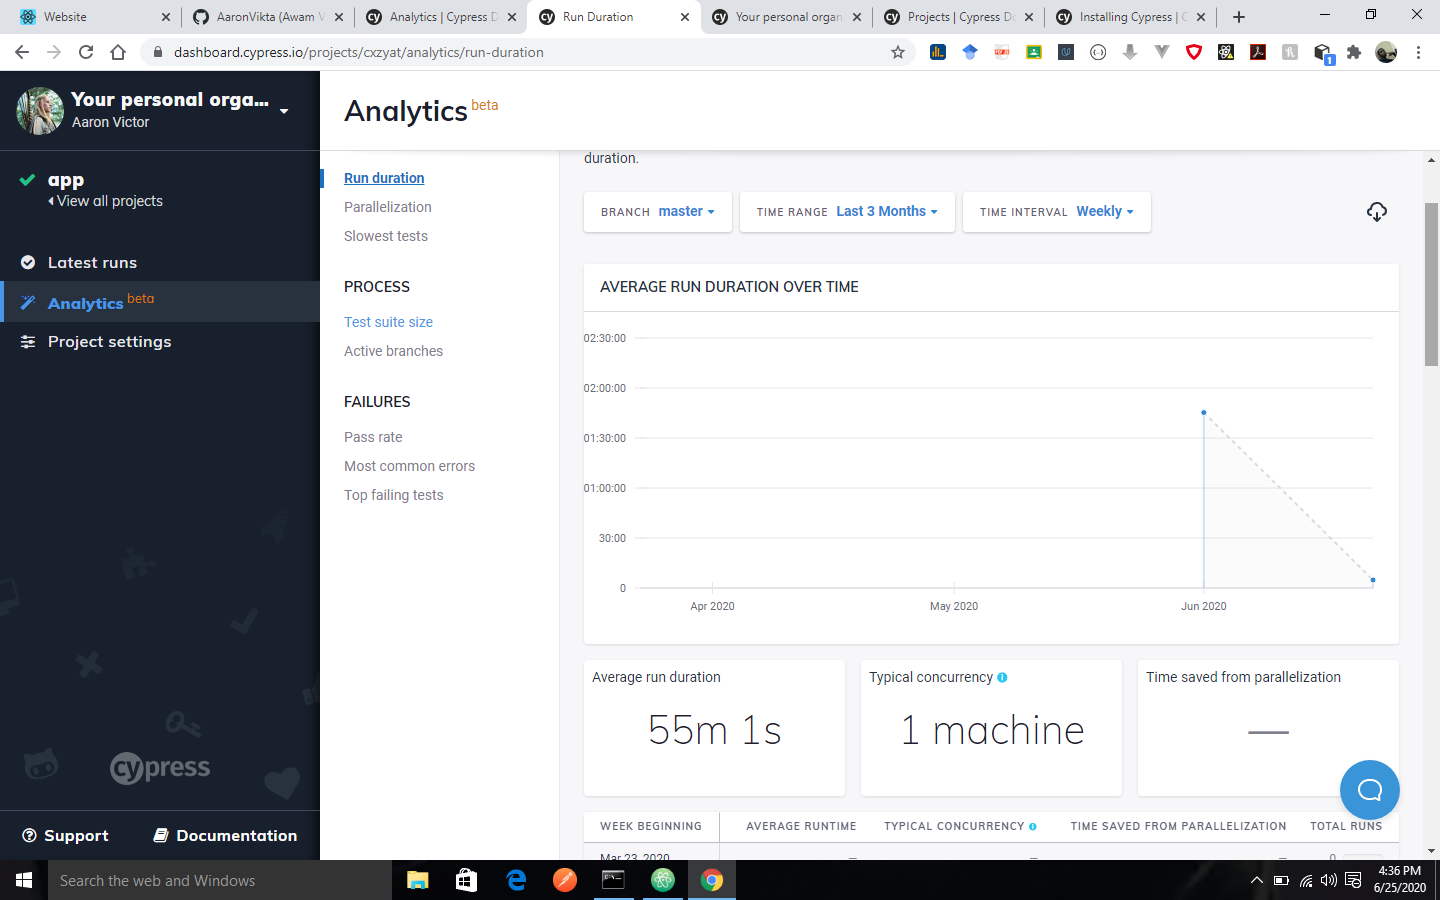
This report will show the average duration of a Cypress run for your project, it includes how test parallelization impacts your total run time. This report only includes passing runs.
You can filter the result by:
- Branch
- Run Group
- Time Range
- Time Interval
Key Performance Indicators
The average personalization, time saved as well as the average run duration will be computed irrespective of the filters selected.

Process
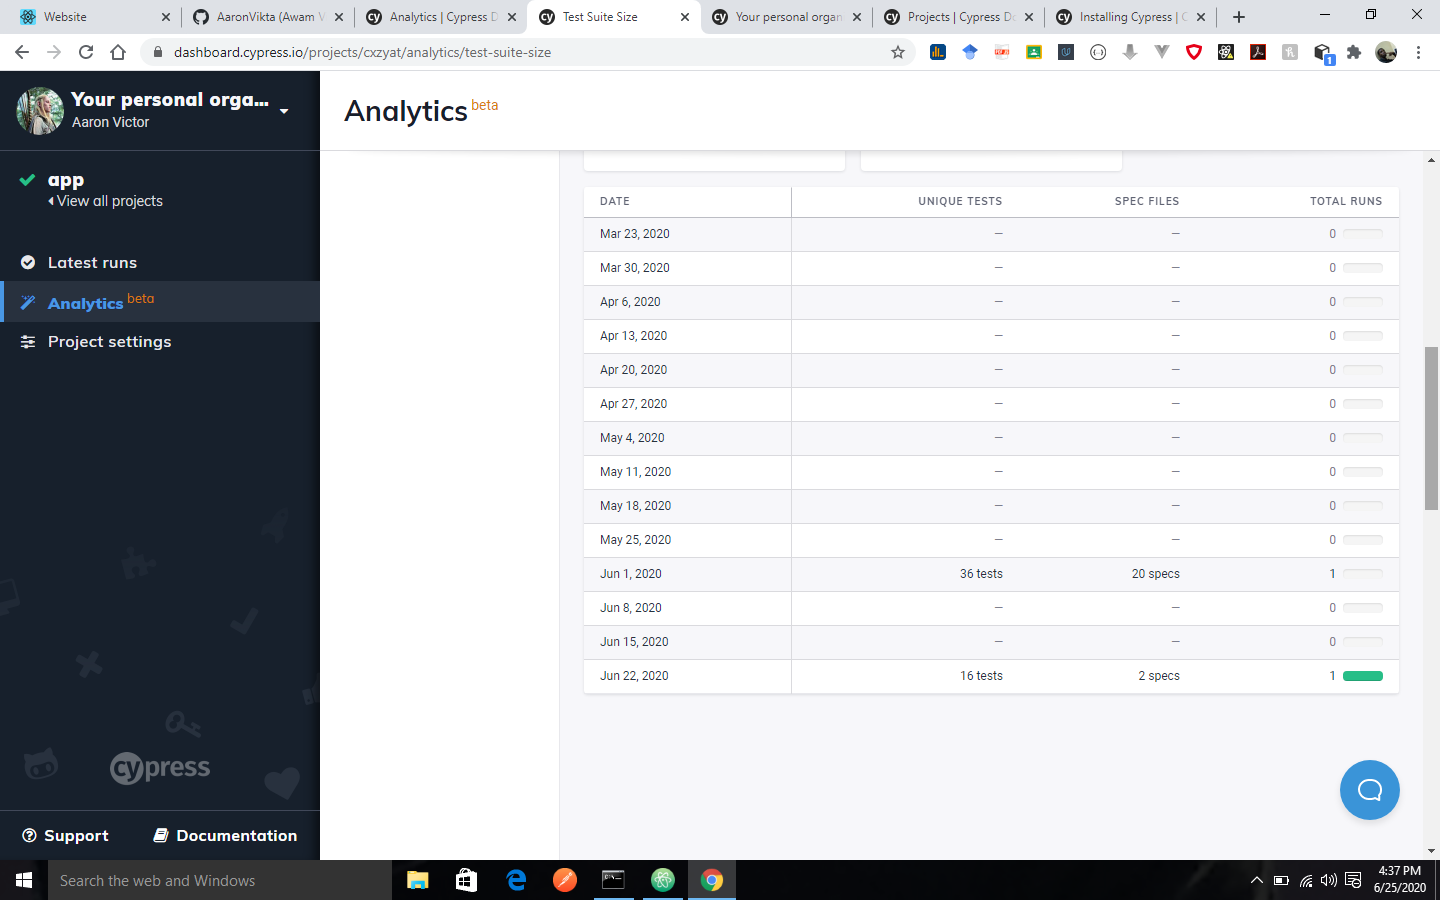
Test suite size
The test suite size shows how your test suite is growing over time. It will calculate the average number of test cases executed per run for each day in the given time period. It will exclude the run that where timed out or errored since they do not accurately represent the size of your test suite. You can filter the result by:
- Branch
- Run Group
- Time Range
The average test suite size over time is displayed irrespective of the filters selected.
The result can be downloaded as a comma-separated values (CSV) file for further analysis.
Key Performance Indicators
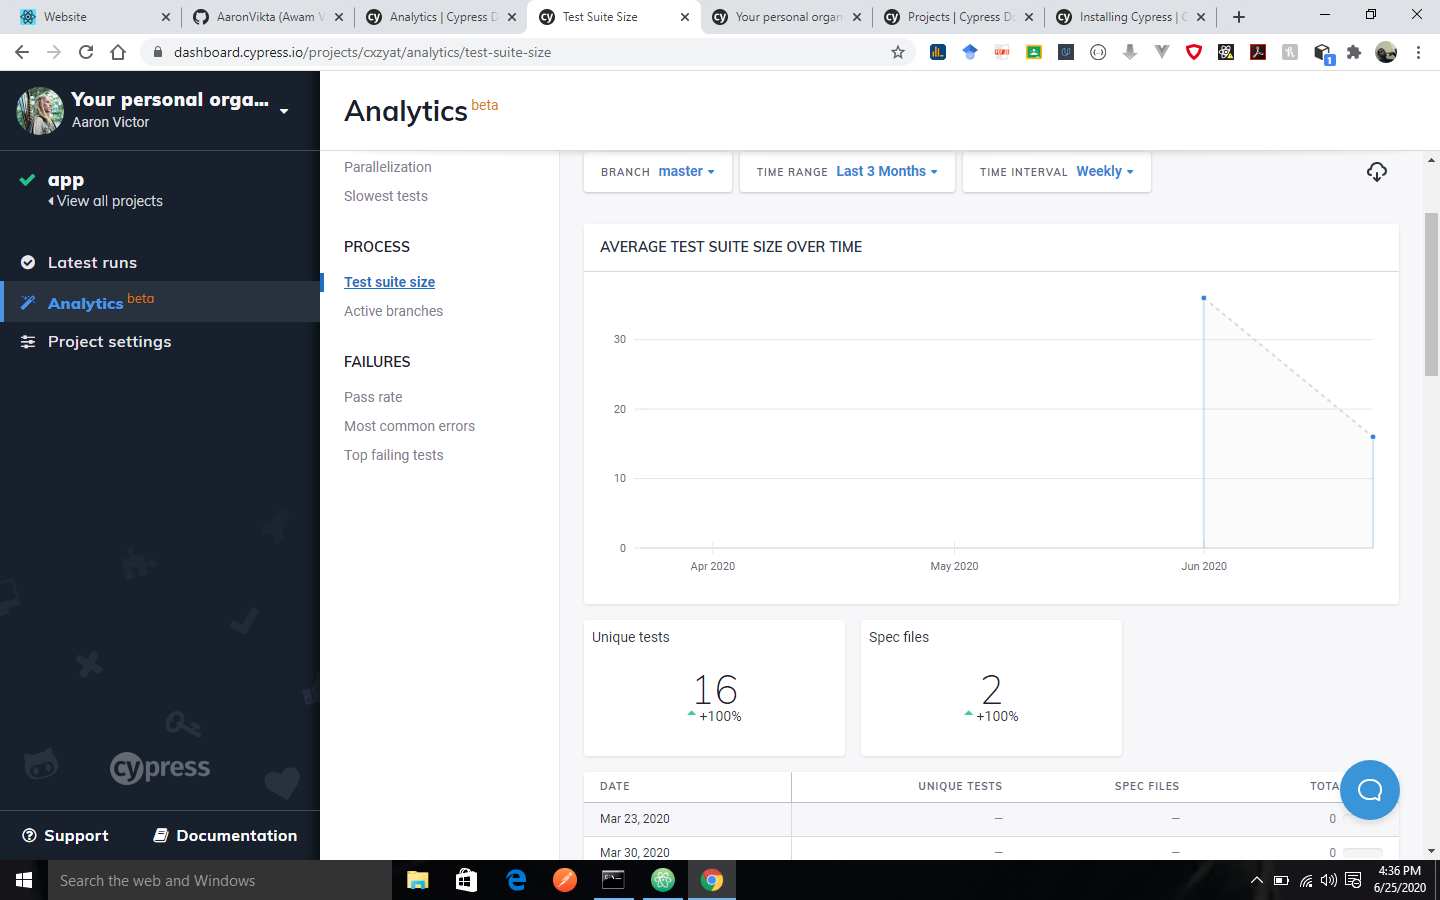
The unique tests and number of spec files will be computed irrespective of the filters selected.