Getting Started with Cypress Dashboard: Features and Management
This tutorial will serve as an introduction to the Cypress Dashboard, it will cover its features- such as where to manage runs, organizations and users. In general, this is an overview of what we are going to be covering in this section of the guide.
The Cypress Dashboard, gives you access to all your recorded tests- this is typically when you are running Cypress tests from your continuous integration provider. The Dashboard will provide you with insight on the performance of your test.
Features
Here are some of the features of the Cypress Dashboard:
Organize projects
The Dashboard provides you with an interface where you can:
- Set up the project that you want to record in the Dashboard
- Either add more key or reset existing ones
- Set up access control to your Cypress project
- Transfer the ownership of projects
- Delete projects
See the results of the test
The Dashboard also enables you to:
- See the number of passing, failing, pending or skipped tests
- Obtain the entire stack trace of the failed tests
- Also view the screenshots that were taken when tests fail or when you use cy.screenshot()
- Watch the video of your entire test run or to watch a video clip at the point where your test failed.
- See how fast your spec file ran within the continuous integration (CI) including whether they were run in parallel.
- See the related groupings of tests
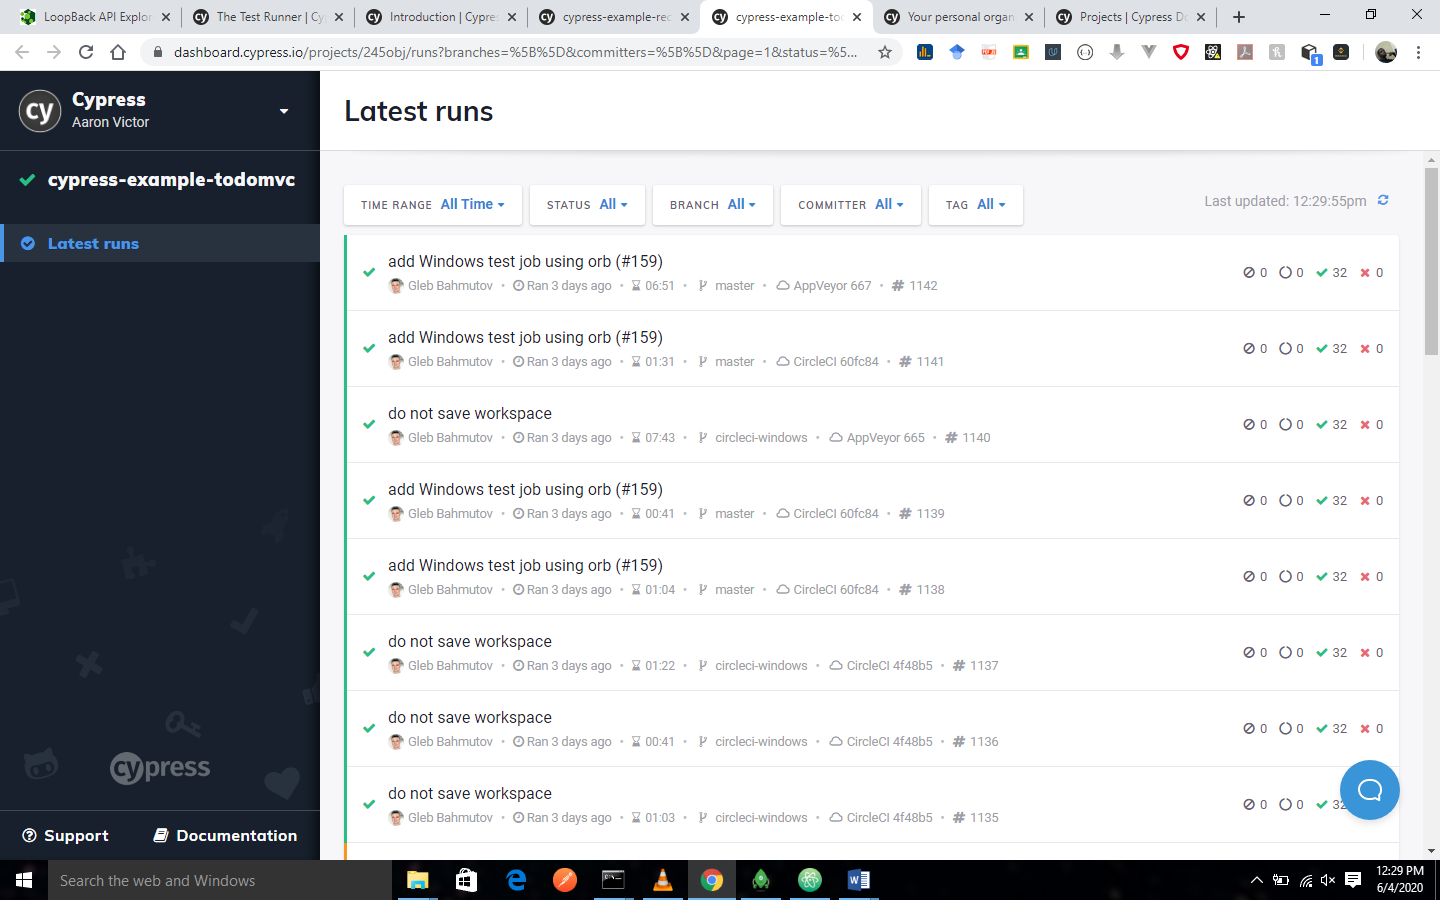
Test result from testing the example-todomvc application of Cypress, the link is given in the example project section of this tutorial.
Manage Runs
The Dashboard enables you to:
- Cancel run that are currently in progress
- Archive runs that are in a canceled or errored state
Manage organizations
The Dashboard enables you to:
- Create, edit or delete organizations
- See the usage details for each organization.
- Pay for your selected billing plan.
Manage users
The Dashboard will enable you to:
- Invite and edit the roles of users for organizations
- Accept or reject requests that are made to join your organization.
Integrate with GitHub
The Dashboard enables you to:
- Integrate your Cypress tests with your GitHub workflow using the commit status checks
- Integrate Cypress into GitHub using pull requests
Integrate with Slack
The Dashboard enables you to integrate Cypress into Slack on every recorded test run.
See tests that runs in the Test Runner
In addition, the test runs have been integrated into Test Runner. What it implies is that you can see the test run in the Runs tab that is within every project.
Example projects
When you log into the Dashboard Service you will be able to view any public project.
Cypress provides some for our consumption, you can check them out below:
- https://dashboard.cypress.io/#/projects/6p53jw (cypress-example-recipes)
- https://dashboard.cypress.io/#/projects/4b7344 (cypress-example-kitchensink)
- https://dashboard.cypress.io/#/projects/245obj (cypress-example-todomvc)
- https://dashboard.cypress.io/#/projects/fuduzp (cypress-example-piechopper)