Writing your first Cypress test: A Step-by-Step Guide
In this tutorial, you will learn how to start testing a new project with Cypress, we will show you what a passing and failing tests look like. Finally, we will show you how to test web navigation, query the DOM as well as how to write assertions.
Prerequisites
- You have installed the Test Runner successfully.
- You have opened the Cypress app.
if you have met the conditions stated above, you can now write your first test, to write our first test, we are going to:
- Create a test_spec.js file
- Observe as Cypress updates our list of specs.
- Then, launch the Cypress Test Runner.
This new file (test_spec.js) should be created in cypress/integration folder created in your project, like so:
'''touch {your_project}/cypress/integration/test_spec.js'''
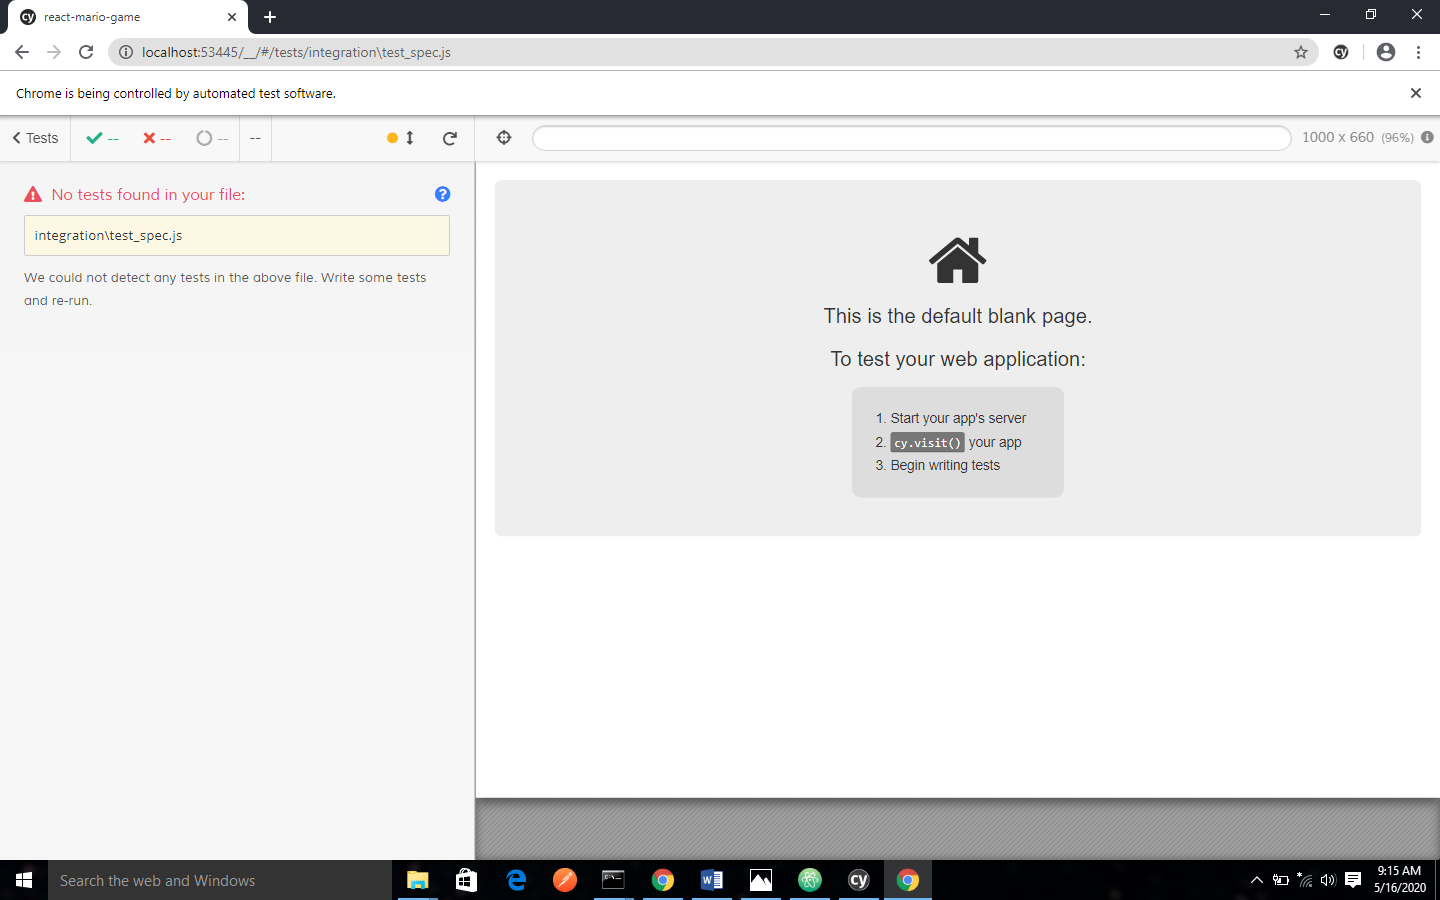
Immediately you create this file, it will be displayed in the list of integration tests displayed in the Test Runner. This is because Cypress automatically monitors your spec files for changes and will automatically display any changes.
Now once you click on test_spec.js Cypress will launch your browser. You should get a page similar to this:
Write your first test
The test_spec.js we showed you above was a blank test. In this section:
- We will write a passing test
- We will also write our first failing test.
- Then, we will watch Cypress reload in real time.
Our browser will auto reload once we save changes made to our file.
Passing Test
Now let us edit our test_spec.js file and add the following code to it:
'''describe('First Cypress Test', () => {
  it("Really doesn't do much!", () => {
    expect(true).to.equal(true)
  })'''
There you have it, your first passing test, although it does not do much; it still does justice to showing you what a passing test looks like.
Failing Test
We have seen a passing test, let us write our first failing test. Add the code below to test_spec.js:
'''describe('Sample Failing Test', () => {
  it('A sample failing test!', () => {
    expect(true).to.equal(false)
  })
})'''
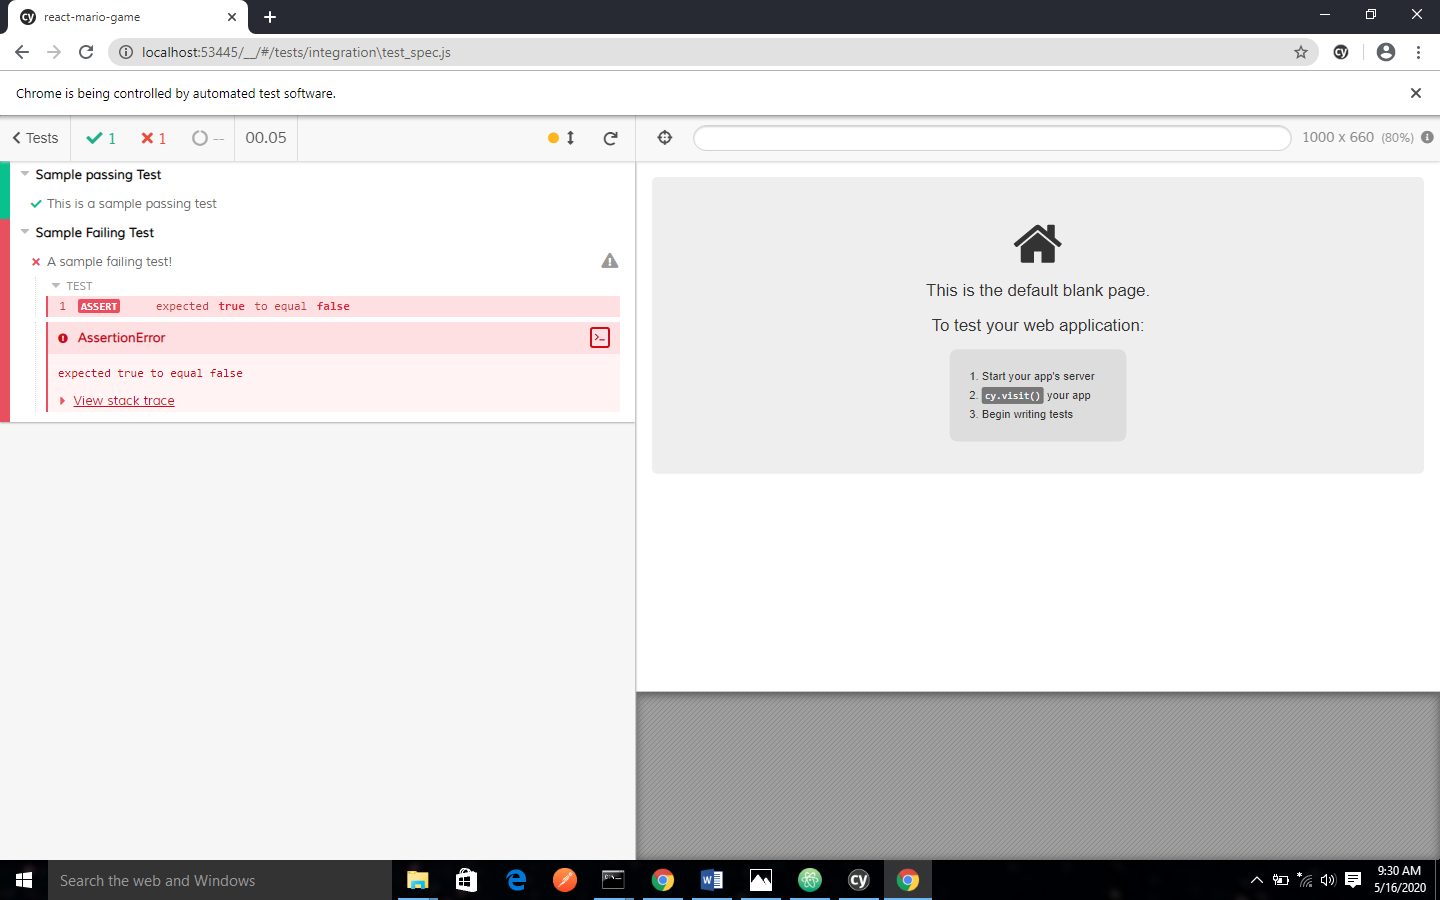
And once you save the file, the browser will reload to show you a failing test.
The combined output for both should be as shown below:
Write a real Test
A solid test usually covers three phases:
- Set up the application state
- Take an action
- Make an assertion about the resulting application state.
This can also be phrased as “Arrange, Act, Assert” or “Given, When, Then”. But the main idea is that: You have to put your application in a state first, then you will take some action in the application that will cause it to change, then you check the resulting state of the application.
In this section we will take a narrow view of these steps and then we will map then to Cypress commands:
- Visit a web page
- Query for an element.
- Interact with that element
- Make assertion about the content on the page.
Step 1: Visit a page
The first step is to visit a web page, we will visit twitters home page, so that you can try Cypress out. I have chosen twitter because it is nearly always available. All we need to do is to pass the URL as an argument to cy.visit(). Replace the code in test_spec.js with this:
'''describe('My First Real Test', () => {
  it('Visit Twitters Home Page', () => {
    cy.visit('https://www.twitter.com')
  })
 })'''
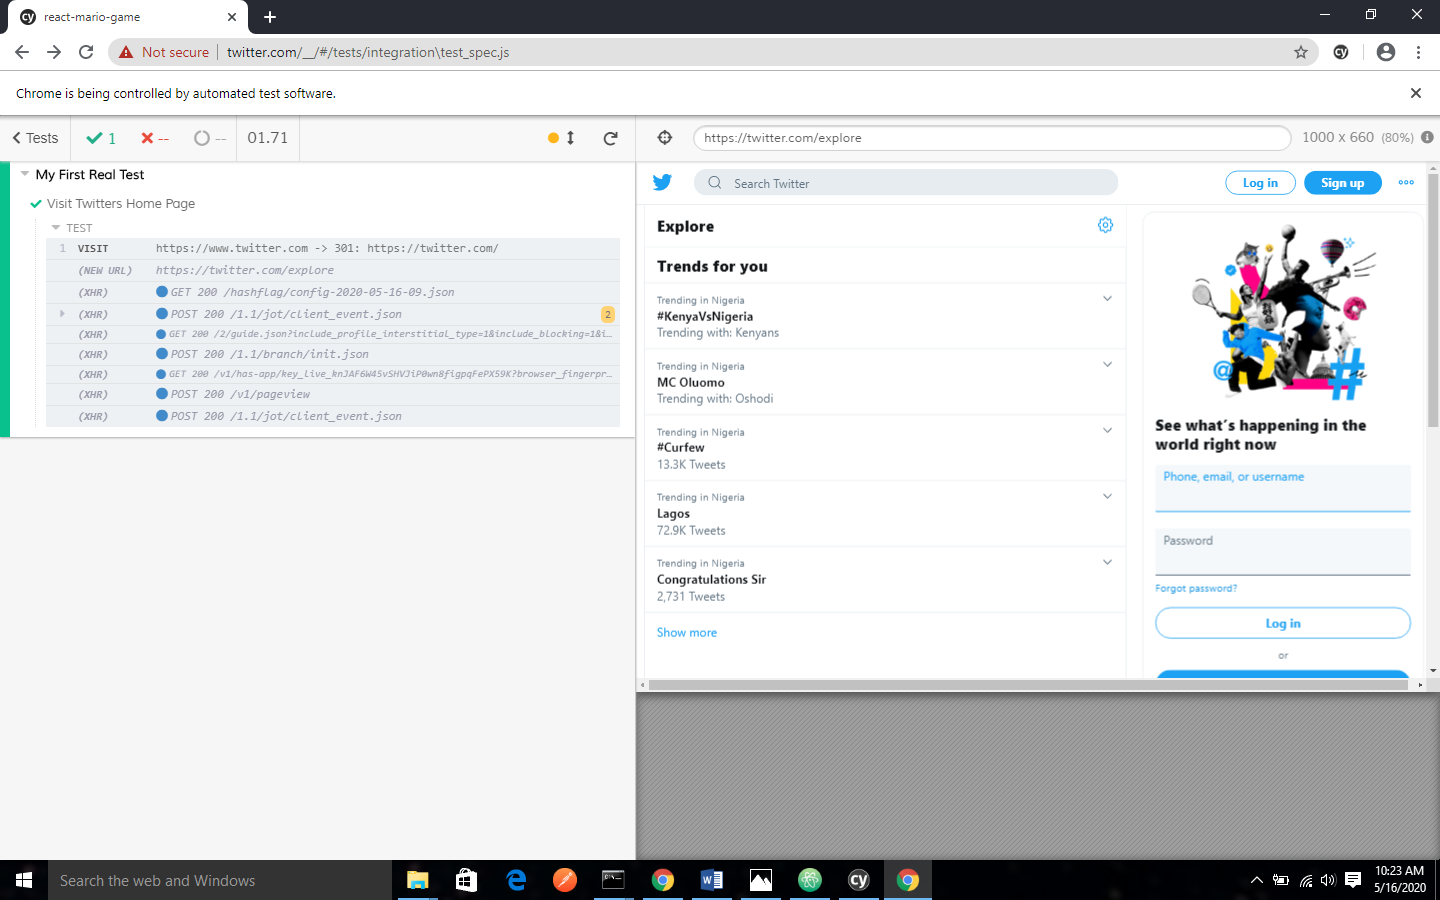
Save and switch back to the Test Runner, you should observe few things:
- The command log now has a VISIT action.
- The twitter Home page has been loaded on the App Preview pane
- The Test is green even though we did not make any assertions.
- The VISIT displayed a blue pending state until the page finished loading.
If the response we got was a non 2xx status code, or if there was a JavaScript error in the code of the application, we would have gotten a failing test. Your passing result should be similar to this:
Step 2: Query for an element
Since we have our application loaded, we can now take some action on it. Let us click on a link on the page. To find an element on the page by its contents we are going to use cy.contains().
Update your test to include this new line of code so that your code will become:
'''describe('My First Real Test', () => {
  it('Visit Twitters Home Page', () => {
    cy.visit('https://www.twitter.com')
    cy.contains('Sign up')
  })
 })'''
If you check the Test Runner, the test now display CONTAINS in the Command Log and it should still be green. We didn't need an assertion to see that everything is okay. This is because Cypress has what is known as default assertion which ensures that commands are built to fail if they don't find what they are looking for.
If will replace Sign up with thisiaahasa the test will go red because it could not find that.
Step 3: Click an element
We can also perform a click event on the element we found. Cypress has a .click() command which we can add to the .contains() command, here is an updated version of the test_spec.js file to illustrate this.
'''describe('My First Real Test', () => {
  it('Visit Twitters Home Page', () => {
    cy.visit('https://www.twitter.com')
    cy.contains('Sign up').click()
  })
 })'''
Your App Preview page should reflect this action as shown below:
Step 4: Make Assertions
At this stage we can make assertions about the page we clicked into. For example, we might want to ensure that the new URL is the expected URL. To do that we have to look up the URL and chain an assertion to it using the .should() command.
Here is an example:
'''describe('My First Real Test', () => {
  it('Visit Twitters Home Page', () => {
    cy.visit('https://www.twitter.com')
    cy.contains('Sign up').click()
    cy.url().should('include', '/flow/signup')
  })
 })'''
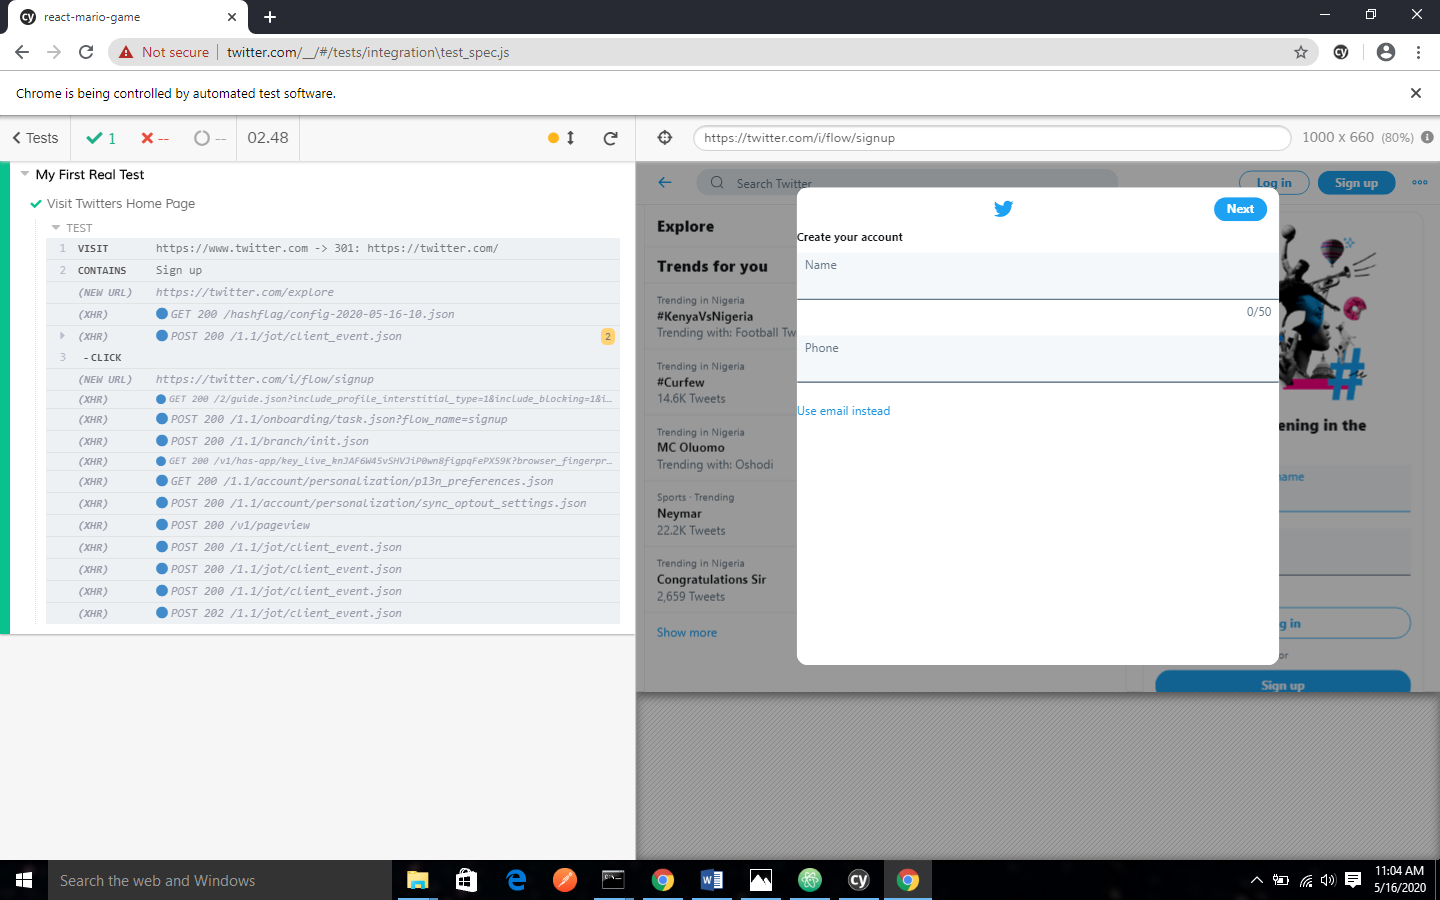
This will yield the following result:
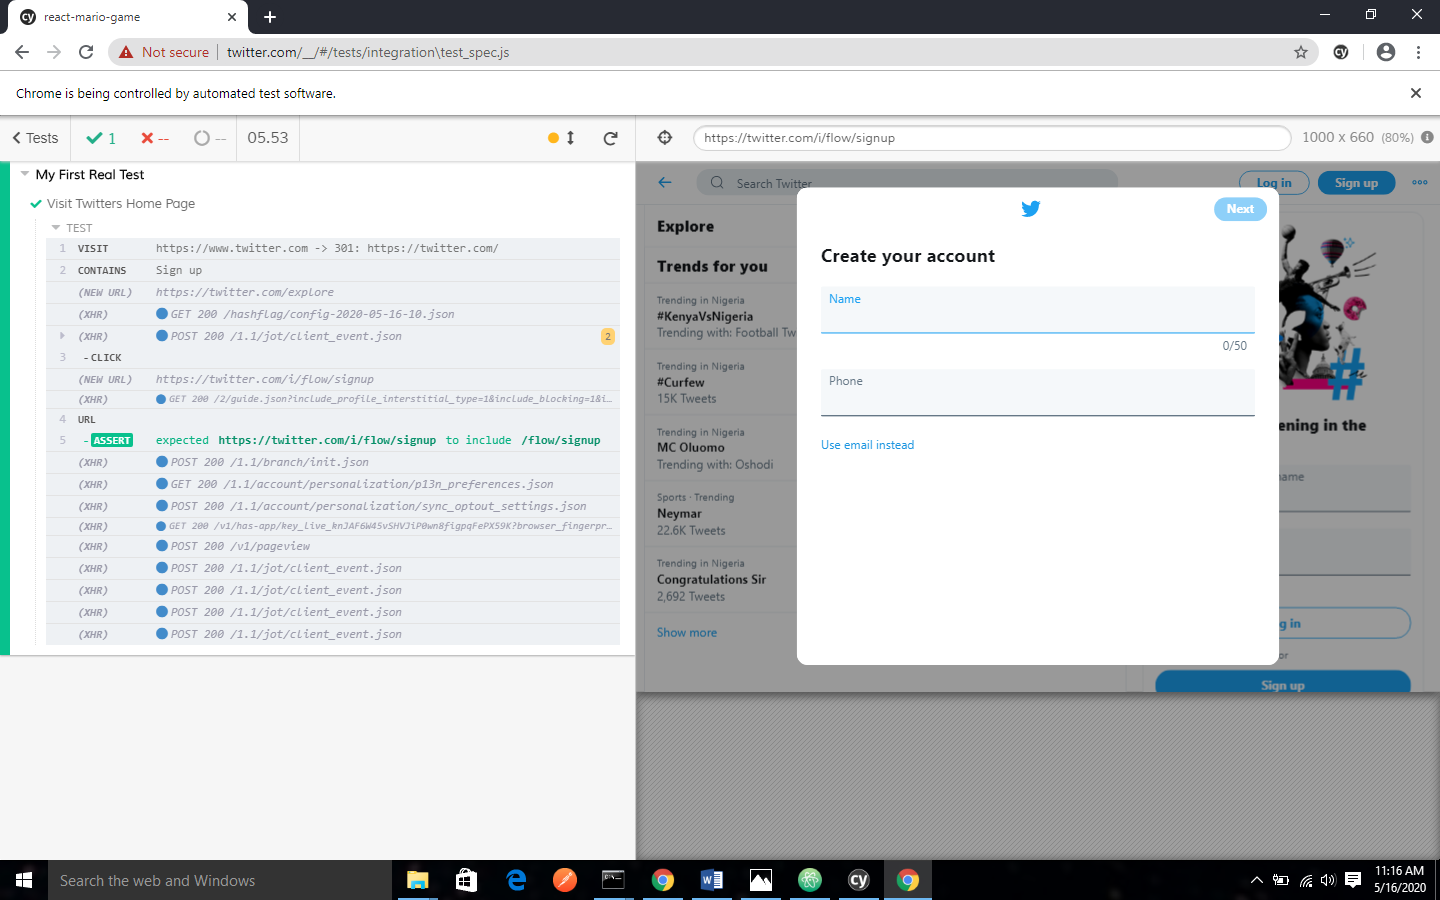
You can add multiple interactions and assertions in a single page.
Debugging
There are a lot of debugging tools in Cypress to help you understand your test. In Cypress you have the ability to:
- Travel back in time to the snapshot of each command.
- See special page events that occurred.
- Receive additional output for each command.
- Step forward / backward between snapshots of multiple command.
- Pause the commands and then step through them iteratively.
- Visualize when there are hidden or multiple elements found.
Time Travel
When you hover over the CONTAINS command on the Command Log, Cypress will automatically travel back in time to a snapshot when that command got resolved. Cypress will also highlight the element that was found by cy.contains().
Snapshots
Commands are equally interactive, when you click on the CLICK command, the command will become highlighted in purple. This did three things, namely:
- Pinned snapshots
- Event hitbox
- Snapshot menu panel
Errors
Cypress will print several pieces of information for you if an error occurs during a Cypress test. They include:
- Error name
- Error message
- Learn more
- View stack trace
- Print to console button
Page events
Cypress logs out important events from your application when they occur. Some examples of these events are PAGE LOAD and NEW URL events.
Console output
Aside the Interactive command of Cypress, you also have additional debugging information in the console of your Dev Tools.
Special commands
Aside the helpful UI of Cypress, you also have access to special commands dedicated for debugging, for instance there is cy.pause() and cy.debug()