Cypress Debugging: Tools and Techniques
In this tutorial, you will learn how Cypress runs in the same event loop with your code, this keeps debugging less demanding and more understandable. We will show you how Cypress embraces the standard Developer Tools as well as how and when you should use debugger and the shorthand .debug() command.
Using debugger
Your Cypress test code will run in the same event loop as your application. This implies that you have access to the code that is running on the page, it also gives you access to the things that the browser makes available to you, such as document, window, and debugger.
Debug just like you always do
With the above statement, you might want to throw a debugger into your test as shown below:
'''it('let me debug like a fiend', () => {
  cy.visit('/my/page/path')

  cy.get('.selector-in-question')

  debugger // Doesn't work
})'''
The above snippet might not work exactly as you are expecting. Recall from our tutorial on Introduction to Cypress, we showed you that cy commands will queue an action to be taken later. With that said, you can see what the test above will do.
Both cy.visit() and cy.get() will return instantly, having queued their work to be done later, while the debugger will be executed before any of the commands have actually run.
If we use the .then() to tap into the Cypress command during execution and add a debugger at the appropriated time, the test will then work as expected:
'''it('let me debug when the after the command executes', () => {
  cy.visit('/my/page/path')

  cy.get('.selector-in-question')
    .then(($selectedElement) => {
      // Debugger will be hit after the cy.visit
      // and cy.get command have completed
      debugger
    })
})'''
Using .debug()
Cypress also exposes a shortcut for you to debug commands, .debug(). Now we can rewrite the above test using this helper method as shown below:
'''it('enable me debug like a fiend', () => {
  cy.visit('/my/page/path')

  cy.get('.selector-in-question')
    .debug()
})'''
The current subject that will be yielded by the cy.get() will be exposed as the variable subject in your Developer Tools so that you can interact with it in the console.
You should use the .debug() helper method when you want to quickly inspect any( or many) part(s) of your application during your test. This can be attached to any Cypress chain of commands in order to have a look at the system’s state at a particular moment.
Using the Developer Tools
Although, Cypress has an excellent Test Runner to help you understand what is happening in your application and your tests, nothing replaces all the amazing work that browser teams have done on their built-in development tools. Once again, we can see that Cypress goes with the modern ecosystem flow, it opts to leverage these tools wherever possible.
Get console logs for commands
Whenever you click on a Cypress command within the Command Log, extra information about the command, its subject and yielded results will be printed.
Errors
There are times when we want something to fail, just so we know that they are testing the right thing when they pass. However, there are times when the tests that fail, fail unintentionally and we have to figure out why they failed. Cypress also provides us with some tools to help us make that process as easy as possible.
Anatomy of an error
Let us explore the anatomy of an error and how it is in Cypress, using a failing test:
'''it('will reroute on users page', () => {
  cy.contains('Users').click()
  cy.url().should('include', 'users')
})'''
The center of the <li> Users </li> element is hdden from view in oure application under test in this example, so the test will fail. An error will show in Cypress on failure that includes the following pieces of information:
- Error name: This indicates the type of the error (e.g. AssertionError, CypressError)
- Error message: This will generally tell you what went wrong. It can vary in length. Some are short like in our example, whereas some are long, and may tell you exactly how you can fix the error. Some may also contain a Learn more link that takes you to relevant Cypress documentation.
- Learn more: This is shown in some error message and links you to relevant Cypress documentation.
- Code frame file: This will usually be the top line of the stack trace and it will show the file, line number, and column number.
- Code frame: This will show a snippet of code where the failure occurred, it will highlight the relevant line and column.
- View stack trace: Clicking this will toggle the visibility of the stack trace. The stack trace varies in length. Clicking on a blue file path opens the file in your preferred file opener.
- Print to console button: Clicking on this will print the full error to your DevTools console. It usually allows you to click on lines in the stack trace and open files in your DevTools.
Source maps
Usually, Cypress will utilize source maps in order to enhance the error experience. The stack traces are translated so that your source files will be shown instead of the generated file that is loaded by the browser. This enables the display of code frames. Cypress includes an inline source map in your spec file by default. So that you will get the most out of the error experience.
If you modify the preprocessor, you should ensure that the inline source maps are enabled so as to get the same experience. If you are using webpack and the webpack preprocessor, for instance, you will need to set the devtool option to inline-source-map.
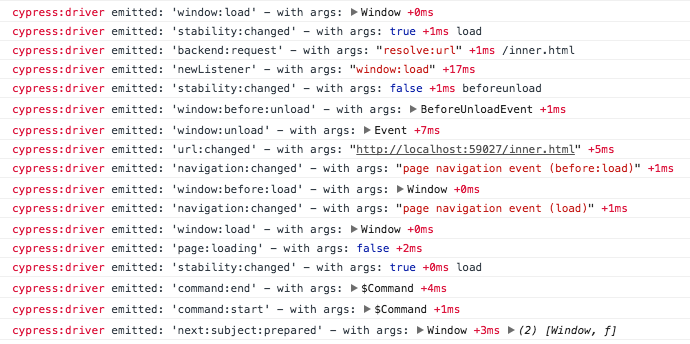
Log Cypress events
Cypress will emit multiple events that you can listen to as shown below:
Run Cypress Command outside the test
If you have to run a Cypress command straight from the Developer Tools console, you can use the internal command cy.now(‘command name’, …arguments).
For instance, if you want to run the equivalent of cy.task(‘database’, 123) outside of the normal execution command chain:
'''cy.now('task', 123)
  .then(console.log)
// will run cy.task(123) and then print the resolved value'''
It should be noted that the cy.now() commad is an internal command and it can change in the future.
Cypress fiddle
It is a good idea to try small tests against some HTML while learning Cypress. The Cypress team have written an @cypress/fiddle plugin for this, which can quickly mount any given HTML and run some Cypress test commands against it.
Troubleshooting Cypress
If you ever experience unexpected behavior or you encounter errors with Cypress itself, it is recommended that you check the tutorial on Troubleshooting Cypress.