Optimizing Cypress tests with variables and aliases
In this tutorial you will learn the names and the purposes of the visual parts of the Cypress Test Runner. We will show you how to use the Selector Playground to target your page elements.
Overview
Cypress will run tests in a unique interactive test runner that will allow you to see the commands as they execute while you are viewing the application under test.
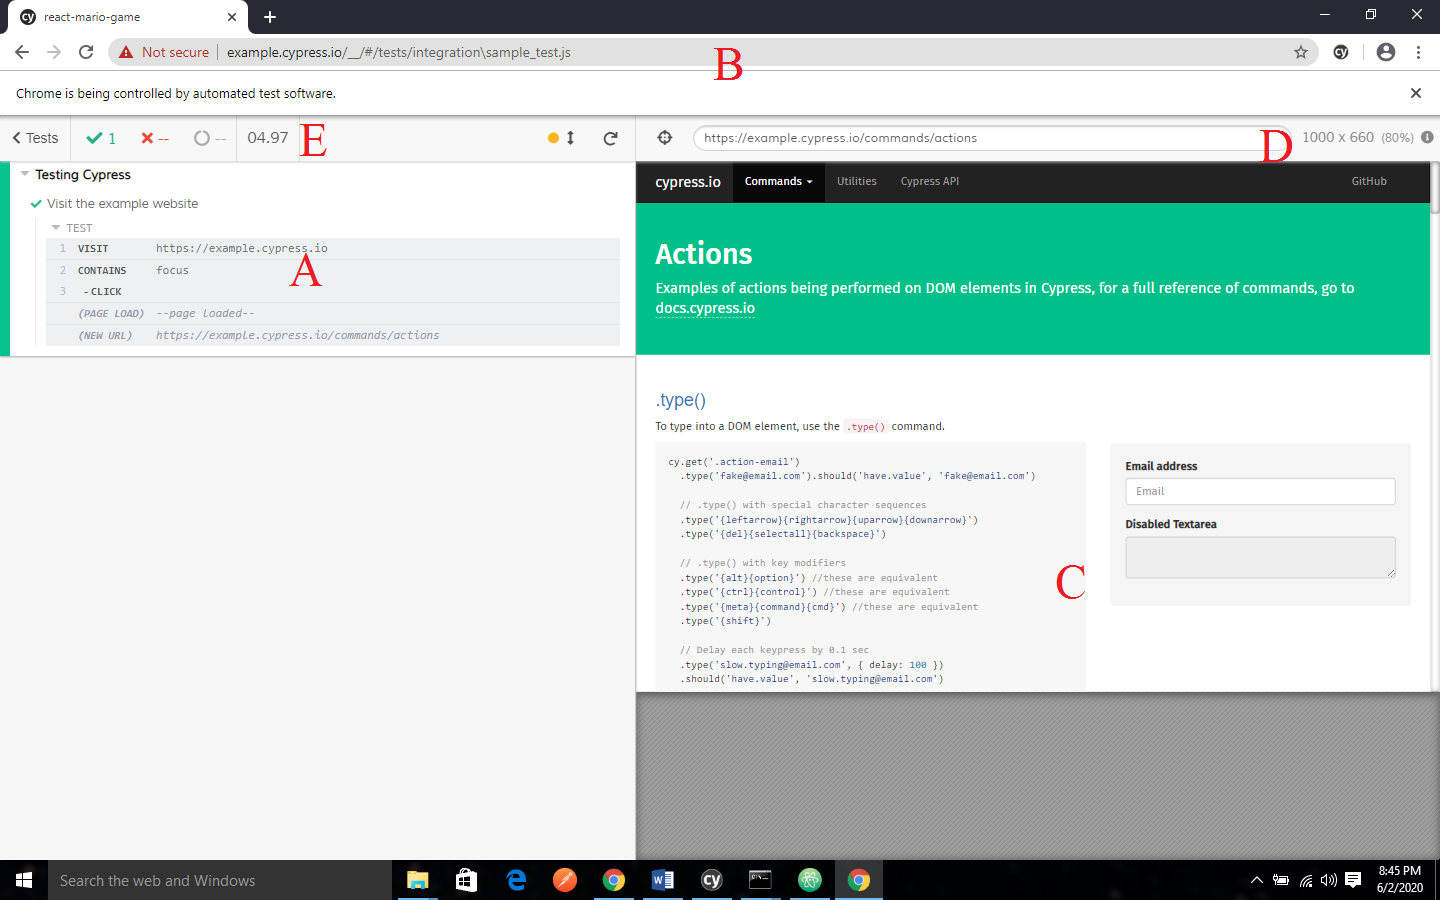
- Command Log: This is used to highlight the affected elements.
- URL Preview: This is the url of your application, it updates as you test.
- App Preview: This is the representation of what your application looks like
- Viewport Sizing: This is used to set up your applications viewport size in order to test responsive layouts.
- Test Status: This will show you how many tests passed or failed
Command Log
The left hand side of the Test Runner provides a visual representation of your test suite. Each test block is nested properly and when you click on a test, it will display all the commands and assertions that are executed in the relevant before, beforeEach, afterEach and after hooks.
Hovering on Commands
When you hover over commands and assertions, it will restore the application that is under test to the state that it was when the command executed. This will enable you to time-travel back to the previous states of your application when you are testing.
Clicking on Commands
When you click on a command, assertion or error, it will display extra information in the dev tools console. When you click on a command it will pin the Application Under test to its previous state when the command was executed.
Errors
Cypress will print several pieces of information when an error occurs during a Cypress test.
This pieces of information include:
- Error name
- Error message
- Learn more
- View stack trace
- Code frame file
- Code frame file
- Print to console button
Instrument Panel
When you use certain commands such as cy.route(), cy.stub() as well as cy.spy(), an extra instrument will be displayed above the tests to provide more information about the state of your tests.
Application Under Test
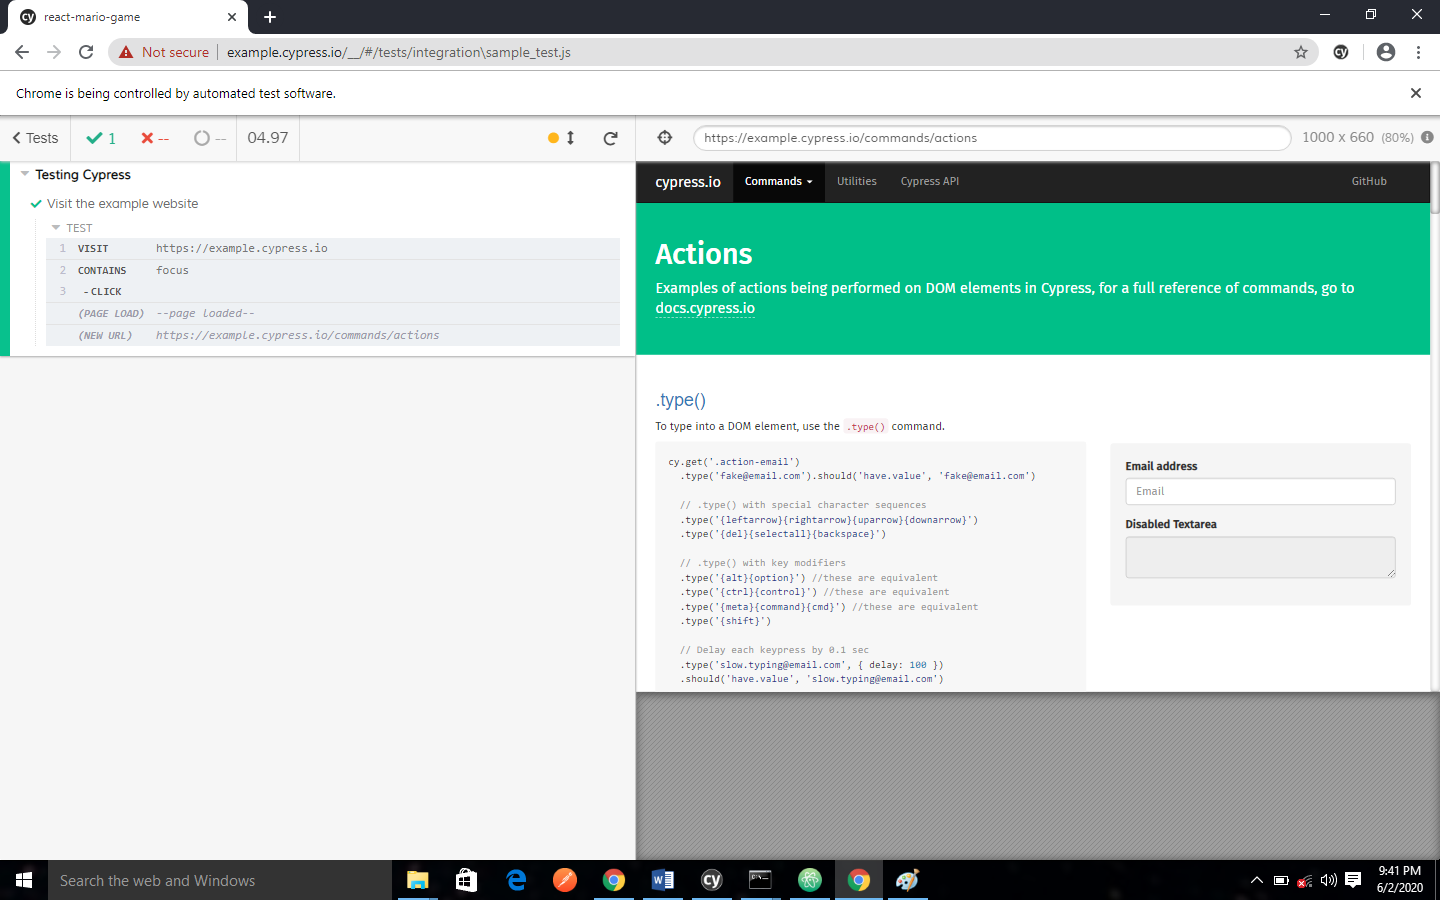
The right hand side of the Test Runner displays the Application Under Test (AUT): this refers to the application that you navigated to using a cy.visit() or any subsequent routing calls that is made from the visited application.
An example is shown below:
describe('Testing Cypress', ()=>{
  it('Visit the example website',()=>{
    cy.visit(`https://example.cypress.io`)
      cy.contains('focus').click()
   })
})
The code above will yield the screenshot shown below, which can be interacted with.

Selector playground
The selector playground is an interactive feature that enables you:
- to determine a unique selector for an element.
- To see what element will match a given selector
- To see what element will match a string of text
Uniqueness
Cypress automatically calculates a unique selector to use targeted elements by going through a series of selector strategies. By default, Cypress will favor:
- data-cy
- data-test
- data-testid
- id
- class
- tag
- attributes
- nth-child
Finding Selectors
When you click on the map icon, the is next to the URL at the top of the Test Runner, it will launch the Selector playground. If you hover over elements in your application, it will preview a unique selector for that element in the tooltip.
When you click on the element its selector will appear, then you can copy it to the clipboard.