NumPy: numpy.geomspace() function
numpy.geomspace() function
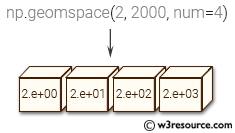
The numpy.geomspace() function returns an array with numbers that are evenly spaced on a log scale between start and stop values. This is similar to logspace, but with endpoints specified directly.
Syntax:
numpy.geomspace(start, stop, num=50, endpoint=True, dtype=None)
Parameters:
| Name | Description | Required / Optional |
|---|---|---|
| start | The starting value of the sequence. | Required |
| stop | The final value of the sequence, unless endpoint is False. In that case, num + 1 values are spaced over the interval in log-space, of which all but the last (a sequence of length num) are returned. | Required |
| num | Number of samples to generate. Default is 50. | Optional |
| endpoint | If True, stop is the last sample. Otherwise, it is not included. Default is True. | Optional |
| dtype | The type of the output array. If dtype is not given, infer the data type from the other input arguments. |
Return value:
ndarray - num samples, equally spaced on a log scale.
Example: Generating logarithmically spaced values with numpy.geomspace
>>> import numpy as np
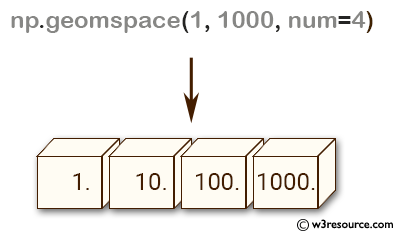
>>> np.geomspace(1, 1000, num=4)
array([ 1., 10., 100., 1000.])
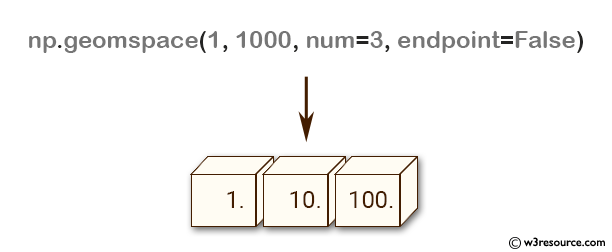
>>> np.geomspace(1, 1000, num=3, endpoint=False)
array([ 1., 10., 100.])
>>> np.geomspace(1, 1000, num=4, endpoint=False)
array([ 1. , 5.62341325, 31.6227766 , 177.827941 ])
>>> np.geomspace(1, 256, num=9)
array([ 1., 2., 4., 8., 16., 32., 64., 128., 256.])
The NumPy.geomspace() function returns an array of num values logarithmically spaced between start and stop, inclusive or exclusive of the endpoints, depending on whether the endpoint argument is set to True or False.
The first example generates an array of 4 logarithmically spaced values between 1 and 1000 inclusive.
The second example generates an array of 3 logarithmically spaced values between 1 and 1000 exclusive (endpoint=False).
The third example generates an array of 4 logarithmically spaced values between 1 and 1000 exclusive (endpoint=False).
The fourth example generates an array of 9 logarithmically spaced values between 1 and 256 inclusive.
Pictorial Presentation:
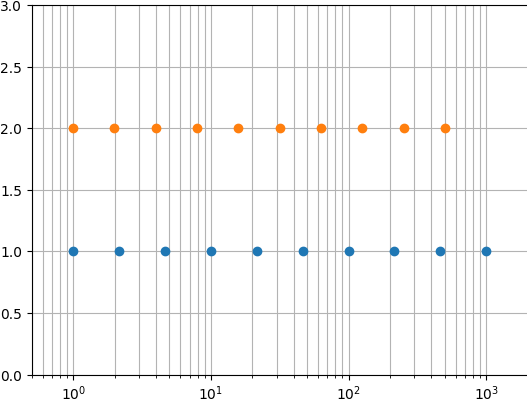
Example: Plotting Data on a Semilogarithmic x-Axis with Matplotlib
>>> import numpy as np
>>> import matplotlib.pyplot as plt
>>> N = 10
>>> y = np.zeros(N)
>>> plt.semilogx(np.geomspace(1, 1000, N, endpoint=True), y + 1, 'o')
>>> plt.semilogx(np.geomspace(1, 1000, N, endpoint=False), y + 2, 'o')
>>> plt.axis([0.5, 2000, 0, 3])
>>> plt.grid(True, color='0.7', linestyle='-', which='both', axis='both')
>>> plt.show()
In the above code np.geomspace() is used to generate logarithmically spaced numbers between 1 and 1000 with N points. Two sets of data are plotted using plt.semilogx(), with the first set using endpoint=True and the second set using endpoint=False. The final plot shows two sets of data plotted on a semilogarithmic x-axis with grid lines.
numpy.logspace.plot show
Python - NumPy Code Editor:
PREV : logspace()
NEXT : meshgrid()