NumPy: numpy.meshgrid() function
numpy.meshgrid() function
The numpy.meshgrid() function is used to get coordinate matrices from coordinate vectors.
Make N-D coordinate arrays for vectorized evaluations of N-D scalar/vector fields over N-D grids, given one-dimensional coordinate arrays x1, x2,…, xn.
Syntax:
numpy.meshgrid(*xi, **kwargs)
Parameters:
| Name | Description | Required / Optional |
|---|---|---|
| x1, x2,…, xn | 1-D arrays representing the coordinates of a grid. | |
| indexing | Cartesian (‘xy’, default) or matrix (‘ij’) indexing of output. See Notes for more details. New in version 1.7.0. |
optional |
| sparse | If True a sparse grid is returned in order to conserve memory. Default is False. New in version 1.7.0. |
optional |
| endpoint | If True, stop is the last sample. Otherwise, it is not included. Default is True. | optional |
| copy | If False, a view into the original arrays are returned in order to conserve memory. Default is True. Please note that sparse=False, copy=False will likely return non-contiguous arrays. Furthermore, more than one element of a broadcast array may refer to a single memory location. If you need to write to the arrays, make copies first. New in version 1.7.0. |
optional |
Return value:
X1, X2,…, XN : ndarray - For vectors x1, x2,…, ‘xn’ with lengths Ni=len(xi) , return (N1, N2, N3,...Nn) shaped arrays if indexing=’ij’ or (N2, N1, N3,...Nn) shaped arrays if indexing=’xy’ with the elements of xi repeated to fill the matrix along the first dimension for x1, the second for x2 and so on.
Example: Create Meshgrid
>>> import numpy as np
>>> ab, ac = (4, 2)
>>> b = np.linspace(0, 1, ab)
>>> c = np.linspace(0, 1, ac)
>>> bd, cd = np.meshgrid(b, c)
>>> bd
array([[ 0.        ,  0.33333333,  0.66666667,  1.        ],
       [ 0.        ,  0.33333333,  0.66666667,  1.        ]])
>>> cd
array([[ 0.,  0.,  0.,  0.],
       [ 1.,  1.,  1.,  1.]])
>>> bd, cd = np.meshgrid(b, c, sparse=True) #make sparse output arrays
>>> bd
array([[ 0.        ,  0.33333333,  0.66666667,  1.        ]])
>>> cd
array([[ 0.],
       [ 1.]])
In the said code, first we define two variables ab and ac to be 4 and 2 respectively. Then we create two arrays b and c using np.linspace() function which creates an array of evenly spaced numbers over a specified interval.
Next, np.meshgrid() is called with b and c as inputs, and the resulting outputs are assigned to bd and cd.
In the next part of the code, np.meshgrid() is called again with the sparse=True argument. This creates the same coordinate grid as before, but returns "sparse" output arrays, where dimensions with size 1 are squeezed out. Thus, bd is now a 1D array containing the values of b, and cd is a 1D array containing the values of c.
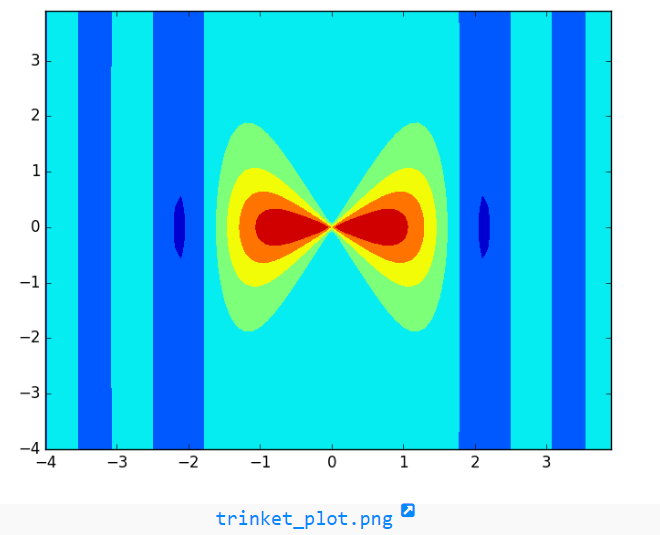
Example: Contour Plot of Sin(x^2) / (x^2 + y^2)
>>> import numpy as np
>>> import matplotlib.pyplot as plt
>>> import numpy as np
>>> a = np.arange(-4, 4, 0.1)
>>> b = np.arange(-4, 4, 0.1)
>>> aa, bb = np.meshgrid(a, b, sparse=True)
>>> c = np.sin(aa**2) / (aa**2 + bb**2)
>>> m = plt.contourf(a,b,c)
>>> plt.show()
The above code generates a contour plot of the function sin(x^2) / (x^2 + y^2). It uses the numpy and matplotlib.pyplot libraries.
numpy.logspace.plot show
Python - NumPy Code Editor:
PREV : geomspace()
NEXT : mgrid()