NumPy: numpy.logspace() function
numpy.logspace() function
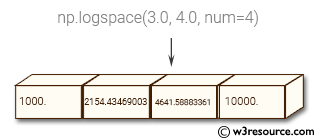
The numpy.logspace() function returns an array with numbers that are evenly spaced on a logarithmic scale. It is similar to linspace() but instead of linearly spaced values, logspace() returns values spaced logarithmically.
Syntax:
numpy.geomspace(start, stop, num=50, endpoint=True, dtype=None)
Parameters:
| Name | Description | Required / Optional |
|---|---|---|
| start | base ** start is the starting value of the sequence. | |
| stop | base ** stop is the final value of the sequence, unless endpoint is False. In that case, num + 1 values are spaced over the interval in log-space, of which all but the last (a sequence of length num) are returned. | |
| num | Number of samples to generate. Default is 50. | optional |
| endpoint | If True, stop is the last sample. Otherwise, it is not included. Default is True. | optional |
| base | The base of the log space. The step size between the elements in ln(samples) / ln(base) (or log_base(samples)) is uniform. Default is 10.0. | optional |
| dtype | The type of the output array. If dtype is not given, infer the data type from the other input arguments. |
Return value:
samples : ndarray - num samples, equally spaced on a log scale.
Example: Logarithmically spaced arrays using NumPy's logspace function.
>>> import numpy as np
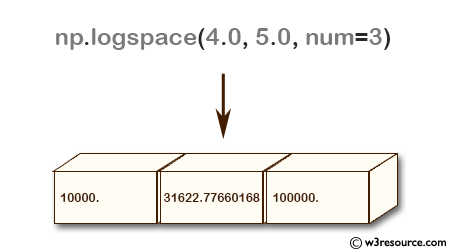
>>> np.logspace(4.0, 5.0, num=3)
array([ 10000. , 31622.77660168, 100000. ])
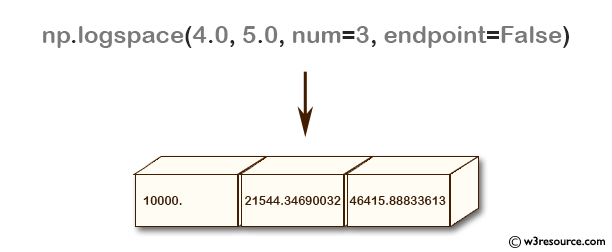
>>> np.logspace(4.0, 5.0, num=3, endpoint=False)
array([ 10000. , 21544.34690032, 46415.88833613])
>>> np.logspace(4.0, 5.0, num=3, base=2.0)
array([ 16. , 22.627417, 32. ])
In the above code example, the numpy.logspace function is used to create three different arrays. The first array is created with num=3 and includes the endpoint, resulting in an array of three logarithmically spaced values between 10^4 and 10^5. The second array is also created with num=3, but the endpoint is not included, so it only includes two logarithmically spaced values between 10^4 and 10^5. The third array is created with base=2.0 and num=3, resulting in an array of three logarithmically spaced values between 2^4 and 2^5.
Pictorial Presentation:
Example: Plotting data points with logarithmic scales on the x-axis
>>> import numpy as np
>>> import matplotlib.pyplot as plt
>>> A=10
>>> a1=np.logspace(0.2, 2, A, endpoint=True)
>>> a2=np.logspace(0.2, 2, A, endpoint=False)
>>> b=np.zeros(A)
>>> plt.plot(a1, b, 'o')
[]
>>> plt.plot(a2, b + 0.4, 'o')
[]
>>> plt.ylim([-0.4, 2])
(-0.4, 2)
>>> plt.show()
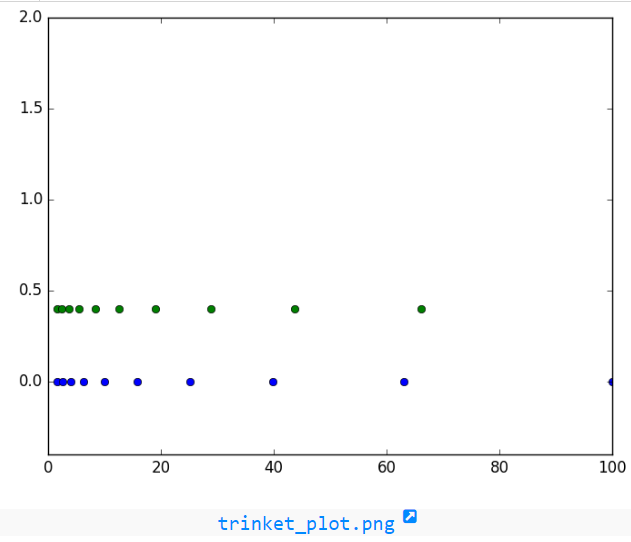
In the above example the code imports the numpy and matplotlib.pyplot modules and generates two sets of logarithmically spaced data points a1 and a2 using np.logspace() function. The endpoint parameter is set to True and False respectively, resulting in 10 data points for each set. A numpy array b of zeros is also created with the same length as a1 and a2.
Next, the plt.plot() function is used to plot the data points on a graph. The first plot shows the data points from a1 and b, represented by circles ('o') with no connecting lines. The second plot shows the data points from a2 and b+0.4 (shifted up by 0.4 units on the y-axis), also represented by circles ('o') with no connecting lines.
The plt.ylim() function sets the y-axis limits to be between -0.4 and 2. Finally, the plt.show() function is called to display the graph. The logarithmic scales on the x-axis can be seen by the spacing between the data points being larger towards the right side of the graph.
numpy.logspace.plot show
Python - NumPy Code Editor:
PREV : linspace()
NEXT : geomspace()